
Page 408 - Bruce Ellig - The Complete Guide to Executive Compensation (2007)
P. 408
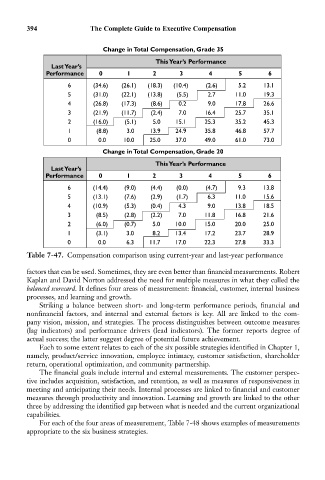
394               The Complete Guide to Executive Compensation


                                 Change in Total Compensation, Grade 35
                                                This Year’s Performance
                   Last Year’s
                 Performance    0       1       2      3        4       5        6
                       6       (34.6)  (26.1)  (18.3)  (10.4)  (2.6)    5.2    13.1
                       5       (31.0)  (22.1)  (13.8)  (5.5)   2.7     11.0    19.3
                       4       (26.8)  (17.3)  (8.6)   0.2     9.0     17.8    26.6
                       3       (21.9)  (11.7)  (2.4)   7.0    16.4     25.7    35.1
                       2       (16.0)   (5.1)   5.0   15.1    25.3     35.2    45.3
                       1        (8.8)   3.0    13.9   24.9    35.8     46.8    57.7
                       0        0.0    10.0    25.0   37.0    49.0     61.0    73.0
                                 Change in Total Compensation, Grade 20
                                                This Year’s Performance
                   Last Year’s
                 Performance    0       1       2      3        4       5        6
                       6       (14.4)   (9.0)  (4.4)  (0.0)    (4.7)    9.3    13.8
                       5       (13.1)   (7.6)  (2.9)  (1.7)    6.3     11.0    15.6
                       4       (10.9)   (5.3)  (0.4)   4.3     9.0     13.8    18.5
                       3       (8.5)    (2.8)  (2.2)   7.0    11.8     16.8    21.6
                       2       (6.0)    (0.7)   5.0   10.0    15.0     20.0    25.0
                       1       (3.1)    3.0     8.2   13.4    17.2     23.7    28.9
                       0        0.0     6.3    11.7   17.0    22.3     27.8    33.3
            Table 7-47. Compensation comparison using current-year and last-year performance

            factors that can be used. Sometimes, they are even better than financial measurements. Robert
            Kaplan and David Norton addressed the need for multiple measures in what they called the
            balanced scorecard. It defines four areas of measurement: financial, customer, internal business
            processes, and learning and growth.
               Striking a balance between short- and long-term performance periods, financial and
            nonfinancial factors, and internal and external factors is key. All are linked to the com-
            pany vision, mission, and strategies. The process distinguishes between outcome measures
            (lag indicators) and performance drivers (lead indicators). The former reports degree of
            actual success; the latter suggest degree of potential future achievement.
               Each to some extent relates to each of the six possible strategies identified in Chapter 1,
            namely, product/service innovation, employee intimacy, customer satisfaction, shareholder
            return, operational optimization, and community partnership.
               The financial goals include internal and external measurements. The customer perspec-
            tive includes acquisition, satisfaction, and retention, as well as measures of responsiveness in
            meeting and anticipating their needs. Internal processes are linked to financial and customer
            measures through productivity and innovation. Learning and growth are linked to the other
            three by addressing the identified gap between what is needed and the current organizational
            capabilities.
               For each of the four areas of measurement, Table 7-48 shows examples of measurements
            appropriate to the six business strategies.