
Page 407 - Bruce Ellig - The Complete Guide to Executive Compensation (2007)
P. 407
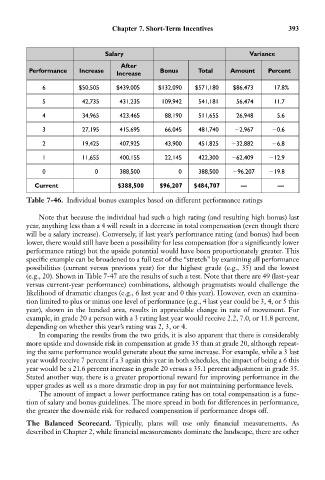
Chapter 7. Short-Term Incentives                  393


                                  Salary                                   Variance
                                      After
            Performance   Increase               Bonus      Total    Amount     Percent
                                     Increase
                6         $50,505    $439,005    $132,090  $571,180   $86,473     17.8%

                5          42,735     431,235     109,942   541,181    56,474     11.7
                4          34,965     423,465      88,190   511,655    26,948      5.6

                3          27,195     415,695      66,045   481,740    2,967      0.6
                2          19,425     407,925      43,900   451,825    32,882     6.8

                1          11,655     400,155      22,145   422,300    62,409    12.9
                0              0      388,500          0    388,500    96.207    19.8

             Current                 $388,500    $96,207   $484,707     —          —
           Table 7-46. Individual bonus examples based on different performance ratings

               Note that because the individual had such a high rating (and resulting high bonus) last
           year, anything less than a 4 will result in a decrease in total compensation (even though there
           will be a salary increase). Conversely, if last year’s performance rating (and bonus) had been
           lower, there would still have been a possibility for less compensation (for a significantly lower
           performance rating) but the upside potential would have been proportionately greater. This
           specific example can be broadened to a full test of the “stretch” by examining all performance
           possibilities (current versus previous year) for the highest grade (e.g., 35) and the lowest
           (e.g., 20). Shown in Table 7-47 are the results of such a test. Note that there are 49 (last-year
           versus current-year performance) combinations, although pragmatists would challenge the
           likelihood of dramatic changes (e.g., 6 last year and 0 this year). However, even an examina-
           tion limited to plus or minus one level of performance (e.g., 4 last year could be 3, 4, or 5 this
           year), shown in the banded area, results in appreciable change in rate of movement. For
           example, in grade 20 a person with a 3 rating last year would receive 2.2, 7.0, or 11.8 percent,
           depending on whether this year’s rating was 2, 3, or 4.
               In comparing the results from the two grids, it is also apparent that there is considerably
           more upside and downside risk in compensation at grade 35 than at grade 20, although repeat-
           ing the same performance would generate about the same increase. For example, while a 3 last
           year would receive 7 percent if a 3 again this year in both schedules, the impact of being a 6 this
           year would be a 21.6 percent increase in grade 20 versus a 35.1 percent adjustment in grade 35.
           Stated another way, there is a greater proportional reward for improving performance in the
           upper grades as well as a more dramatic drop in pay for not maintaining performance levels.
               The amount of impact a lower performance rating has on total compensation is a func-
           tion of salary and bonus guidelines. The more spread in both for differences in performance,
           the greater the downside risk for reduced compensation if performance drops off.
           The Balanced Scorecard. Typically, plans will use only financial measurements. As
           described in Chapter 2, while financial measurements dominate the landscape, there are other