
Page 402 - Bruce Ellig - The Complete Guide to Executive Compensation (2007)
P. 402
388 The Complete Guide to Executive Compensation
Salary Average Guide Guide
Grade Employees Salary Percent Bonus
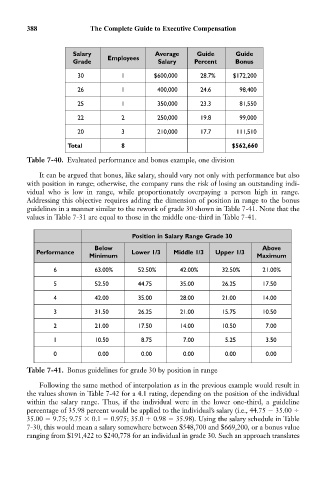
30 1 $600,000 28.7% $172,200
26 1 400,000 24.6 98,400
25 1 350,000 23.3 81,550
22 2 250,000 19.8 99,000
20 3 210,000 17.7 111,510
Total 8 $562,660
Table 7-40. Evaluated performance and bonus example, one division
It can be argued that bonus, like salary, should vary not only with performance but also
with position in range; otherwise, the company runs the risk of losing an outstanding indi-
vidual who is low in range, while proportionately overpaying a person high in range.
Addressing this objective requires adding the dimension of position in range to the bonus
guidelines in a manner similar to the rework of grade 30 shown in Table 7-41. Note that the
values in Table 7-31 are equal to those in the middle one-third in Table 7-41.
Position in Salary Range Grade 30
Below Above
Performance Lower 1/3 Middle 1/3 Upper 1/3
Minimum Maximum
6 63.00% 52.50% 42.00% 32.50% 21.00%
5 52.50 44.75 35.00 26.25 17.50
4 42.00 35.00 28.00 21.00 14.00
3 31.50 26.25 21.00 15.75 10.50
2 21.00 17.50 14.00 10.50 7.00
1 10.50 8.75 7.00 5.25 3.50
0 0.00 0.00 0.00 0.00 0.00
Table 7-41. Bonus guidelines for grade 30 by position in range
Following the same method of interpolation as in the previous example would result in
the values shown in Table 7-42 for a 4.1 rating, depending on the position of the individual
within the salary range. Thus, if the individual were in the lower one-third, a guideline
percentage of 35.98 percent would be applied to the individual’s salary (i.e., 44.75 35.00
35.00 9.75; 9.75 0.1 0.975; 35.0 0.98 35.98). Using the salary schedule in Table
7-30, this would mean a salary somewhere between $548,700 and $669,200, or a bonus value
ranging from $191,422 to $240,778 for an individual in grade 30. Such an approach translates