Page 397 - Bruce Ellig - The Complete Guide to Executive Compensation (2007)
P. 397
Chapter 7. Short-Term Incentives                  383


                         0        1         2         3        4          5        6
                       Un-                                    Very                Out-
             Grade             Marginal Acceptable  Good              Superior
                    acceptable                                Good              standing
              35        0        33.0%     67.0%    100.0%   133.0%    167.0%     200.0%
              34        0        32.0      63.0      95.0    127.0     158.0      190.0
              33        0        30.0      60.0      90.0    120.0     150.0      180.0
              32        0        28.0      57.0      85.0    113.0     142.0      170.0
              31        0        27.0      53.0      80.0    107.0     133.0      160.0
              30        0        25.0      50.0      75.0    100.0     125.0      150.0
              29        0        23.0      47.0      70.0     93.0     117.0      140.0
              28        0        22.0      43.0      65.0     87.0     108.0      130.0
              27        0        20.0      40.0      60.0     80.0     100.0      120.0
              26        0        18.0      37.0      55.0     73.0      92.0      110.0
              25        0        17.0      33.0      50.0     67.0      83.0      100.0
              24        0        15.0      30.0      45.0     60.0      75.0      90.0
              23        0        13.0      27.0      40.0     53.0      67.0      80.0
              22        0        12.0      23.0      35.0     47.0      58.0      70.0
              21        0        10.0      20.0      30.0     40.0      50.0      60.0
              20        0         8.0      17.0      25.0     33.0      42.0      50.0
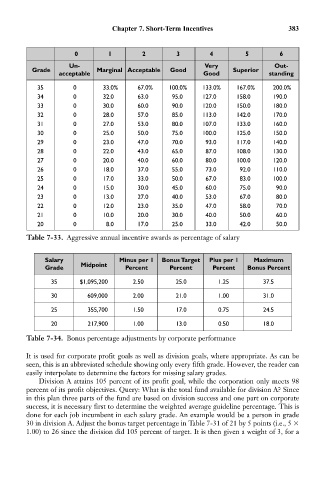
           Table 7-33. Aggressive annual incentive awards as percentage of salary


                Salary                Minus per 1  Bonus Target   Plus per 1  Maximum
                           Midpoint
                Grade                  Percent      Percent     Percent   Bonus Percent
                  35      $1,095,200      2.50        25.0        1.25         37.5

                  30        609,000       2.00        21.0        1.00         31.0
                  25         355,700      1.50        17.0        0.75         24.5
                  20         217,900      1.00        13.0        0.50         18.0

           Table 7-34. Bonus percentage adjustments by corporate performance

           It is used for corporate profit goals as well as division goals, where appropriate. As can be
           seen, this is an abbreviated schedule showing only every fifth grade. However, the reader can
           easily interpolate to determine the factors for missing salary grades.
               Division A attains 105 percent of its profit goal, while the corporation only meets 98
           percent of its profit objectives. Query: What is the total fund available for division A? Since
           in this plan three parts of the fund are based on division success and one part on corporate
           success, it is necessary first to determine the weighted average guideline percentage. This is
           done for each job incumbent in each salary grade. An example would be a person in grade
           30 in division A. Adjust the bonus target percentage in Table 7-31 of 21 by 5 points (i.e., 5
           1.00) to 26 since the division did 105 percent of target. It is then given a weight of 3, for a

