
Page 394 - Bruce Ellig - The Complete Guide to Executive Compensation (2007)
P. 394
380 The Complete Guide to Executive Compensation
Salary Bonus Total Compensation
Grade Minimum Lower 1/3 Upper 1/3 Maximum Midpoint Maximum Midpoint Maximum
35 $1,000.7 $1,063.7 $1,126.6 $1,189.6 $1,095.2 $591.5 $1,390.9 $1,781.1
34 884.1 942.5 1,000.9 1,058.3 971.7 505.4 1,224.4 1,564.7
33 785.2 837.4 889.5 941.7 863.5 440.3 1,083.6 1,382.0
32 695.5 743.9 792.4 840.8 768.2 376.3 956.3 1,271.1
31 617.5 660.7 703.8 747.0 682.3 327.5 846.0 1,074.5
30 548.7 588.9 629.0 669.2 609.0 280.1 749.0 949.3
29 489.1 526.6 564.0 601.5 545.3 239.8 665.2 841.3
28 486.8 470.4 504.0 537.6 487.2 209.4 591.9 747.0
27 391.4 422.8 454.3 485.7 438.6 179.7 528.4 665.4
26 350.8 380.1 409.5 438.8 394.8 154.0 471.8 592.8
25 315.9 342.4 369.0 395.5 355.7 135.2 423.3 530.7
24 285.1 310.1 335.0 360.0 322.6 116.1 380.6 476.1
23 257.1 280.5 303.9 327.3 292.2 99.4 341.9 426.7
22 233.0 255.1 277.1 299.2 266.1 85.2 308.7 384.4
21 210.6 231.4 252.2 273.0 241.8 72.4 278.0 345.4
20 189.7 208.5 227.2 246.0 217.9 63.3 249.5 309.3
19 172.3 190.0 207.6 225.3 198.8 53.8 225.7 279.1
18 156.0 172.6 189.3 205.9 181.0 45.3 203.6 251.2
17 142.2 157.9 173.5 189.2 165.7 38.2 184.8 227.4
16 128.9 144.3 158.8 173.2 151.6 33.3 168.2 206.5
15 118.9 132.6 146.2 159.9 139.4 28.0 153.4 187.9
14 108.6 121.6 134.6 147.6 128.1 23.0 139.6 170.6
13 99.8 111.7 123.6 135.5 117.7 20.1 127.7 155.6
12 92.3 103.7 115.0 126.4 109.4 16.5 117.6 142.9
11 84.3 95.1 106.0 116.8 100.6 13.1 107.1 129.9
10 78.0 88.4 98.7 109.1 83.6 10.3 98.7 119.4
9 72.1 82.0 91.8 101.7 86.9 7.8 90.8 109.5
8 66.8 76.2 85.7 95.1 81.0 5.7 83.8 100.8
7 62.2 71.1 80.0 88.9 75.6 4.5 77.8 93.4
6 58.0 66.2 74.5 82.7 70.4 4.3 72.5 87.0
5 54.2 61.9 69.7 77.4 65.8 3.8 67.7 81.2
4 50.4 57.6 64.8 72.0 61.2 3.6 63.0 75.6
3 47.0 53.7 60.5 67.2 57.1 3.4 58.8 70.6
2 43.6 49.8 56.0 62.2 52.9 3.2 54.5 65.4
1 40.6 46.4 52.2 58.0 49.3 3.0 50.8 61.0
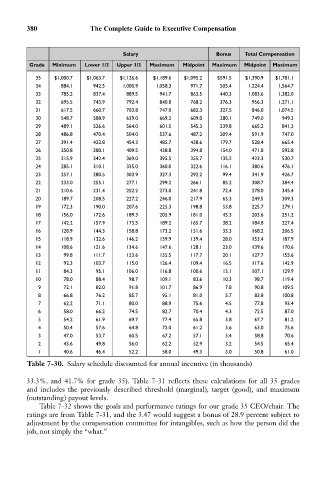
Table 7-30. Salary schedule discounted for annual incentive (in thousands)
33.3%, and 41.7% for grade 35). Table 7-31 reflects these calculations for all 35 grades
and includes the previously described threshold (marginal), target (good), and maximum
(outstanding) payout levels.
Table 7-32 shows the goals and performance ratings for our grade 35 CEO/chair. The
ratings are from Table 7-31, and the 3.47 would suggest a bonus of 28.9 percent subject to
adjustment by the compensation committee for intangibles, such as how the person did the
job, not simply the “what.”