
Page 391 - Bruce Ellig - The Complete Guide to Executive Compensation (2007)
P. 391
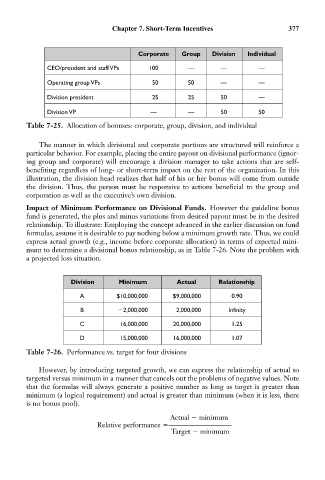
Chapter 7. Short-Term Incentives                  377


                                           Corporate   Group    Division  Individual

                 CEO/president and staff VPs  100        —         —         —
                 Operating group VPs           50        50        —         —

                 Division president            25        25        50        —

                 Division VP                   —         —         50        50
           Table 7-25. Allocation of bonuses: corporate, group, division, and individual

               The manner in which divisional and corporate portions are structured will reinforce a
           particular behavior. For example, placing the entire payout on divisional performance (ignor-
           ing group and corporate) will encourage a division manager to take actions that are self-
           benefiting regardless of long- or short-term impact on the rest of the organization. In this
           illustration, the division head realizes that half of his or her bonus will come from outside
           the division. Thus, the person must be responsive to actions beneficial to the group and
           corporation as well as the executive’s own division.

           Impact of Minimum Performance on Divisional Funds. However the guideline bonus
           fund is generated, the plus and minus variations from desired payout must be in the desired
           relationship. To illustrate: Employing the concept advanced in the earlier discussion on fund
           formulas, assume it is desirable to pay nothing below a minimum growth rate. Thus, we could
           express actual growth (e.g., income before corporate allocation) in terms of expected mini-
           mum to determine a divisional bonus relationship, as in Table 7-26. Note the problem with
           a projected loss situation.


                        Division     Minimum          Actual      Relationship

                          A          $10,000,000     $9,000,000       0.90
                          B           2,000,000       2,000,000      Infinity
                          C           16,000,000     20,000,000       1.25

                          D           15,000,000     16,000,000       1.07
           Table 7-26. Performance vs. target for four divisions

               However, by introducing targeted growth, we can express the relationship of actual to
           targeted versus minimum in a manner that cancels out the problems of negative values. Note
           that the formulas will always generate a positive number as long as target is greater than
           minimum (a logical requirement) and actual is greater than minimum (when it is less, there
           is no bonus pool).

                                                    Actual   minimum
                               Relative performance  —————————
                                                    Target   minimum