
Page 396 - Bruce Ellig - The Complete Guide to Executive Compensation (2007)
P. 396
382 The Complete Guide to Executive Compensation
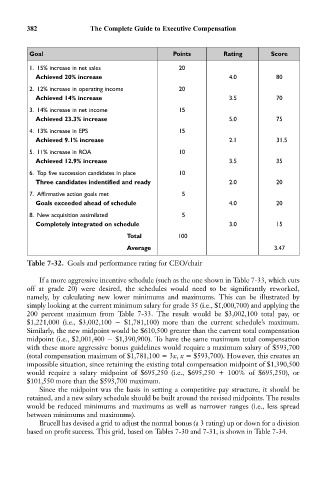
Goal Points Rating Score
1. 15% increase in net sales 20
Achieved 20% increase 4.0 80
2. 12% increase in operating income 20
Achieved 14% increase 3.5 70
3. 14% increase in net income 15
Achieved 23.3% increase 5.0 75
4. 13% increase in EPS 15
Achieved 9.1% increase 2.1 31.5
5. 11% increase in ROA 10
Achieved 12.9% increase 3.5 35
6. Top five succession candidates in place 10
Three candidates indentified and ready 2.0 20
7. Affirmative action goals met 5
Goals exceeded ahead of schedule 4.0 20
8. New acquisition assimilated 5
Completely integrated on schedule 3.0 15
Total 100
Average 3.47
Table 7-32. Goals and performance rating for CEO/chair
If a more aggressive incentive schedule (such as the one shown in Table 7-33, which cuts
off at grade 20) were desired, the schedules would need to be significantly reworked,
namely, by calculating new lower minimums and maximums. This can be illustrated by
simply looking at the current minimum salary for grade 35 (i.e., $1,000,700) and applying the
200 percent maximum from Table 7-33. The result would be $3,002,100 total pay, or
$1,221,000 (i.e., $3,002,100 $1,781,100) more than the current schedule’s maximum.
Similarly, the new midpoint would be $610,500 greater than the current total compensation
midpoint (i.e., $2,001,400 $1,390,900). To have the same maximum total compensation
with these more aggressive bonus guidelines would require a maximum salary of $593,700
(total compensation maximum of $1,781,100 3x, x $593,700). However, this creates an
impossible situation, since retaining the existing total compensation midpoint of $1,390,500
would require a salary midpoint of $695,250 (i.e., $695,250 100% of $695,250), or
$101,550 more than the $593,700 maximum.
Since the midpoint was the basis in setting a competitive pay structure, it should be
retained, and a new salary schedule should be built around the revised midpoints. The results
would be reduced minimums and maximums as well as narrower ranges (i.e., less spread
between minimums and maximums).
Brucell has devised a grid to adjust the normal bonus (a 3 rating) up or down for a division
based on profit success. This grid, based on Tables 7-30 and 7-31, is shown in Table 7-34.