
Page 401 - Bruce Ellig - The Complete Guide to Executive Compensation (2007)
P. 401
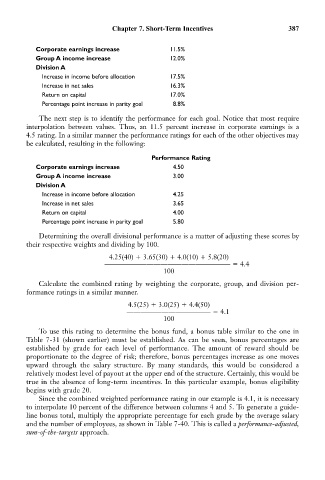
Chapter 7. Short-Term Incentives                  387


              Corporate earnings increase           11.5%
              Group A income increase               12.0%
              Division A
                Increase in income before allocation  17.5%
                Increase in net sales               16.3%
                Return on capital                   17.0%
                Percentage point increase in parity goal  8.8%

               The next step is to identify the performance for each goal. Notice that most require
           interpolation between values. Thus, an 11.5 percent increase in corporate earnings is a
           4.5 rating. In a similar manner the performance ratings for each of the other objectives may
           be calculated, resulting in the following:

                                               Performance Rating
              Corporate earnings increase            4.50
              Group A income increase                3.00
              Division A
                Increase in income before allocation  4.25
                Increase in net sales                3.65
                Return on capital                    4.00
                Percentage point increase in parity goal  5.80

               Determining the overall divisional performance is a matter of adjusting these scores by
           their respective weights and dividing by 100.
                                   4.25(40)   3.65(30)   4.0(10)   5.8(20)
                                 ——————————————————   4.4
                                                  100
               Calculate the combined rating by weighting the corporate, group, and division per-
           formance ratings in a similar manner.
                                        4.5(25)   3.0(25)   4.4(50)
                                        ————————————   4.1
                                                  100

               To use this rating to determine the bonus fund, a bonus table similar to the one in
           Table 7-31 (shown earlier) must be established. As can be seen, bonus percentages are
           established by grade for each level of performance. The amount of reward should be
           proportionate to the degree of risk; therefore, bonus percentages increase as one moves
           upward through the salary structure. By many standards, this would be considered a
           relatively modest level of payout at the upper end of the structure. Certainly, this would be
           true in the absence of long-term incentives. In this particular example, bonus eligibility
           begins with grade 20.
               Since the combined weighted performance rating in our example is 4.1, it is necessary
           to interpolate 10 percent of the difference between columns 4 and 5. To generate a guide-
           line bonus total, multiply the appropriate percentage for each grade by the average salary
           and the number of employees, as shown in Table 7-40. This is called a performance-adjusted,
           sum-of-the-targets approach.