
Page 403 - Bruce Ellig - The Complete Guide to Executive Compensation (2007)
P. 403
Chapter 7. Short-Term Incentives 389
Below Above
Minimum Lower 1/3 Middle 1/3 Upper 1/3 Maximum
44.05% 35.98% 28.70% 21.53% 14.35%
Table 7-42. Interpolated bonus guidelines using position in range
not only to higher bonus percentages for those low in range but also to higher bonus dollars
(e.g., compare $197,422 and $240,778 in this example with $172,200 in Table 7-40).
While such an approach is more logical, it is also more cumbersome, and for this reason,
many do not see it as administratively practical.
Division and Individual Performance. In many instances, the division president receives a
fund to be allocated that has already been reduced by the president’s own award (normally
the guideline amount). Typically, he or she does not have carte blanche on the distribution
but must submit a list of proposals for review and approval by either the CEO or the com-
pensation committee of the board of directors.
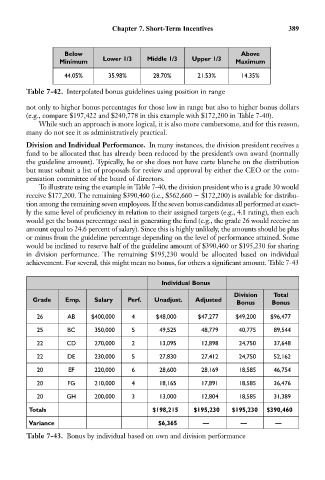
To illustrate using the example in Table 7-40, the division president who is a grade 30 would
receive $177,200. The remaining $390,460 (i.e., $562,660 $172,200) is available for distribu-
tion among the remaining seven employees. If the seven bonus candidates all performed at exact-
ly the same level of proficiency in relation to their assigned targets (e.g., 4.1 rating), then each
would get the bonus percentage used in generating the fund (e.g., the grade 26 would receive an
amount equal to 24.6 percent of salary). Since this is highly unlikely, the amounts should be plus
or minus from the guideline percentage depending on the level of performance attained. Some
would be inclined to reserve half of the guideline amount of $390,460 or $195,230 for sharing
in division performance. The remaining $195,230 would be allocated based on individual
achievement. For several, this might mean no bonus, for others a significant amount. Table 7-43
Individual Bonus
Division Total
Grade Emp. Salary Perf. Unadjust. Adjusted
Bonus Bonus
26 AB $400,000 4 $48,000 $47,277 $49,200 $96,477
25 BC 350,000 5 49,525 48,779 40,775 89,544
22 CD 270,000 2 13,095 12,898 24,750 37,648
22 DE 230,000 5 27,830 27,412 24,750 52,162
20 EF 220,000 6 28,600 28,169 18,585 46,754
20 FG 210,000 4 18,165 17,891 18,585 36,476
20 GH 200,000 3 13,000 12,804 18,585 31,389
Totals $198,215 $195,230 $195,230 $390,460
Variance $6,365 — — —
Table 7-43. Bonus by individual based on own and division performance