
Page 400 - Bruce Ellig - The Complete Guide to Executive Compensation (2007)
P. 400
386 The Complete Guide to Executive Compensation
Income Before
Allocation, Evaluation
Millions
$1.5 6
1.0 5
0.5 4
0.0 3
0.5 2
1.0 1
More 0
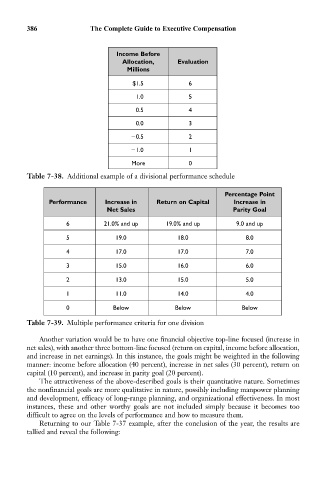
Table 7-38. Additional example of a divisional performance schedule
Percentage Point
Performance Increase in Return on Capital Increase in
Net Sales Parity Goal
6 21.0% and up 19.0% and up 9.0 and up
5 19.0 18.0 8.0
4 17.0 17.0 7.0
3 15.0 16.0 6.0
2 13.0 15.0 5.0
1 11.0 14.0 4.0
0 Below Below Below
Table 7-39. Multiple performance criteria for one division
Another variation would be to have one financial objective top-line focused (increase in
net sales), with another three bottom-line focused (return on capital, income before allocation,
and increase in net earnings). In this instance, the goals might be weighted in the following
manner: income before allocation (40 percent), increase in net sales (30 percent), return on
capital (10 percent), and increase in parity goal (20 percent).
The attractiveness of the above-described goals is their quantitative nature. Sometimes
the nonfinancial goals are more qualitative in nature, possibly including manpower planning
and development, efficacy of long-range planning, and organizational effectiveness. In most
instances, these and other worthy goals are not included simply because it becomes too
difficult to agree on the levels of performance and how to measure them.
Returning to our Table 7-37 example, after the conclusion of the year, the results are
tallied and reveal the following: