
Page 392 - Bruce Ellig - The Complete Guide to Executive Compensation (2007)
P. 392
378 The Complete Guide to Executive Compensation
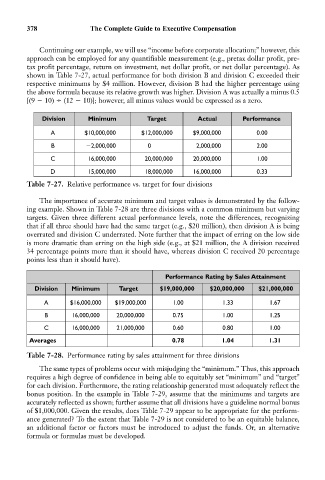
Continuing our example, we will use “income before corporate allocation;” however, this
approach can be employed for any quantifiable measurement (e.g., pretax dollar profit, pre-
tax profit percentage, return on investment, net dollar profit, or net dollar percentage). As
shown in Table 7-27, actual performance for both division B and division C exceeded their
respective minimums by $4 million. However, division B had the higher percentage using
the above formula because its relative growth was higher. Division A was actually a minus 0.5
[(9 10) (12 10)]; however, all minus values would be expressed as a zero.
Division Minimum Target Actual Performance
A $10,000,000 $12,000,000 $9,000,000 0.00
B 2,000,000 0 2,000,000 2.00
C 16,000,000 20,000,000 20,000,000 1.00
D 15,000,000 18,000,000 16,000,000 0.33
Table 7-27. Relative performance vs. target for four divisions
The importance of accurate minimum and target values is demonstrated by the follow-
ing example. Shown in Table 7-28 are three divisions with a common minimum but varying
targets. Given three different actual performance levels, note the differences, recognizing
that if all three should have had the same target (e.g., $20 million), then division A is being
overrated and division C underrated. Note further that the impact of erring on the low side
is more dramatic than erring on the high side (e.g., at $21 million, the A division received
34 percentage points more than it should have, whereas division C received 20 percentage
points less than it should have).
Performance Rating by Sales Attainment
Division Minimum Target $19,000,000 $20,000,000 $21,000,000
A $16,000,000 $19,000,000 1.00 1.33 1.67
B 16,000,000 20,000,000 0.75 1.00 1.25
C 16,000,000 21,000,000 0.60 0.80 1.00
Averages 0.78 1.04 1.31
Table 7-28. Performance rating by sales attainment for three divisions
The same types of problems occur with misjudging the “minimum.” Thus, this approach
requires a high degree of confidence in being able to equitably set “minimum” and “target”
for each division. Furthermore, the rating relationship generated must adequately reflect the
bonus position. In the example in Table 7-29, assume that the minimums and targets are
accurately reflected as shown; further assume that all divisions have a guideline normal bonus
of $1,000,000. Given the results, does Table 7-29 appear to be appropriate for the perform-
ance generated? To the extent that Table 7-29 is not considered to be an equitable balance,
an additional factor or factors must be introduced to adjust the funds. Or, an alternative
formula or formulas must be developed.