
Page 578 - Bruce Ellig - The Complete Guide to Executive Compensation (2007)
P. 578
564 The Complete Guide to Executive Compensation
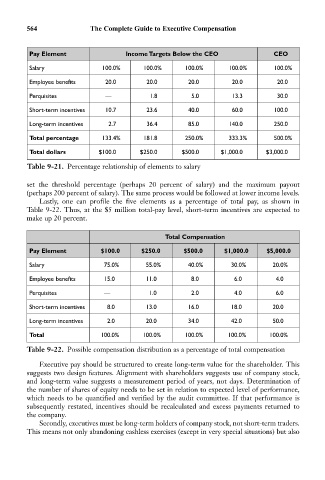
Pay Element Income Targets Below the CEO CEO
Salary 100.0% 100.0% 100.0% 100.0% 100.0%
Employee benefits 20.0 20.0 20.0 20.0 20.0
Perquisites — 1.8 5.0 13.3 30.0
Short-term incentives 10.7 23.6 40.0 60.0 100.0
Long-term incentives 2.7 36.4 85.0 140.0 250.0
Total percentage 133.4% 181.8 250.0% 333.3% 500.0%
Total dollars $100.0 $250.0 $500.0 $1,000.0 $3,000.0
Table 9-21. Percentage relationship of elements to salary
set the threshold percentage (perhaps 20 percent of salary) and the maximum payout
(perhaps 200 percent of salary). The same process would be followed at lower income levels.
Lastly, one can profile the five elements as a percentage of total pay, as shown in
Table 9-22. Thus, at the $5 million total-pay level, short-term incentives are expected to
make up 20 percent.
Total Compensation
Pay Element $100.0 $250.0 $500.0 $1,000.0 $5,000.0
Salary 75.0% 55.0% 40.0% 30.0% 20.0%
Employee benefits 15.0 11.0 8.0 6.0 4.0
Perquisites — 1.0 2.0 4.0 6.0
Short-term incentives 8.0 13.0 16.0 18.0 20.0
Long-term incentives 2.0 20.0 34.0 42.0 50.0
Total 100.0% 100.0% 100.0% 100.0% 100.0%
Table 9-22. Possible compensation distribution as a percentage of total compensation
Executive pay should be structured to create long-term value for the shareholder. This
suggests two design features. Alignment with shareholders suggests use of company stock,
and long-term value suggests a measurement period of years, not days. Determination of
the number of shares of equity needs to be set in relation to expected level of performance,
which needs to be quantified and verified by the audit committee. If that performance is
subsequently restated, incentives should be recalculated and excess payments returned to
the company.
Secondly, executives must be long-term holders of company stock, not short-term traders.
This means not only abandoning cashless exercises (except in very special situations) but also