
Page 582 - Bruce Ellig - The Complete Guide to Executive Compensation (2007)
P. 582
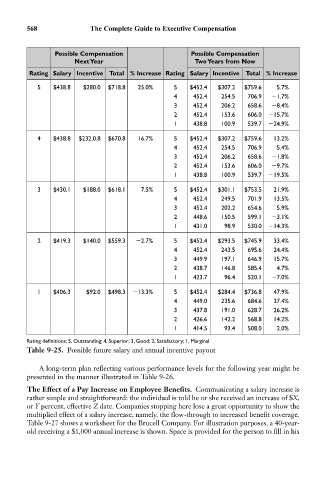
568               The Complete Guide to Executive Compensation


                    Possible Compensation                  Possible Compensation
                         Next Year                          Two Years from Now
            Rating Salary Incentive Total % Increase Rating Salary Incentive Total % Increase
               5   $438.8   $280.0  $718.8  25.0%     5   $452.4  $307.2  $759.6   5.7%
                                                      4    452.4   254.5   706.9   1.7%
                                                      3    452.4   206.2   658.6   8.4%
                                                      2    452.4   153.6   606.0   15.7%
                                                      1    438.8   100.9   539.7   24.9%
               4   $438.8  $232.0.8  $670.8  16.7%    5   $452.4  $307.2  $759.6  13.2%
                                                      4    452.4   254.5   706.9   5.4%
                                                      3    452.4   206.2   658.6   1.8%
                                                      2    452.4   153.6   606.0   9.7%
                                                      1    438.8   100.9   539.7   19.5%
               3   $430.1   $188.0  $618.1  7.5%      5   $452.4  $301.1  $753.5  21.9%
                                                      4    452.4   249.5   701.9  13.5%
                                                      3    452.4   202.2   654.6   5.9%
                                                      2    448.6   150.5   599.1   3.1%
                                                      1    431.0    98.9   530.0   14.3%

               2   $419.3   $140.0  $559.3   2.7%     5   $452.4  $293.5  $745.9  33.4%
                                                      4    452.4   243.5   695.6  24.4%
                                                      3    449.9   197.1   646.9  15.7%
                                                      2    438.7   146.8   585.4   4.7%
                                                      1    423.7    96.4   520.1   7.0%

               1   $406.3    $92.0  $498.3   13.3%    5   $452.4  $284.4  $736.8  47.9%
                                                      4    449.0   235.6   684.6  37.4%
                                                      3    437.8   191.0   628.7  26.2%
                                                      2    426.6   142.2   568.8  14.2%
                                                      1    414.5    93.4   508.0   2.0%

            Rating definitions: 5, Outstanding; 4, Superior; 3, Good; 2, Satisfactory; 1, Marginal
            Table 9-25. Possible future salary and annual incentive payout

               A long-term plan reflecting various performance levels for the following year might be
            presented in the manner illustrated in Table 9-26.
            The Effect of a Pay Increase on Employee Benefits. Communicating a salary increase is
            rather simple and straightforward: the individual is told he or she received an increase of $X,
            or Y percent, effective Z date. Companies stopping here lose a great opportunity to show the
            multiplied effect of a salary increase, namely, the flow-through to increased benefit coverage.
            Table 9-27 shows a worksheet for the Brucell Company. For illustration purposes, a 40-year-
            old receiving a $1,000 annual increase is shown. Space is provided for the person to fill in his