
Page 581 - Bruce Ellig - The Complete Guide to Executive Compensation (2007)
P. 581
Chapter 9. Design and Communication Considerations 567
Annual Compensation
Year Earned (Proxy) Year Paid (W2)
Year 4 Year 5 Year 4 Year 5
Salary $375.0 $400.0 $375.0 $400.0
Annual incentives 175.0 NA 150.0 175.0
Performance shares 165.0 NA — 165.0
Total $715.0 NA $525.0 $740.0
Stock Options
Number of Shares Vested at Year-End
Grant Year Option Price Year 4 Year 5 Year 6 Year 7 Total
1 $57.50 15,000 15,000
2 45.50 15,000 15,000 30,000
3 78.50 — 15,000 15,000 30,000
4 105.00 — — 15,000 15,000 30,000
Total 30,000 30,000 30,000 15,000 105,000
Performance Share Awards
Share Schedule Paid Out in First Quarter of …
Plan Period Threshold Target Maximum Year 5 Year 6 Year 7 Year 8
1–4 1,000 10,000 25,000 15,000
2–4 1,000 10,000 25,000
3–6 1,000 10,000 25,000
4–7 1,000 10,000 25,000
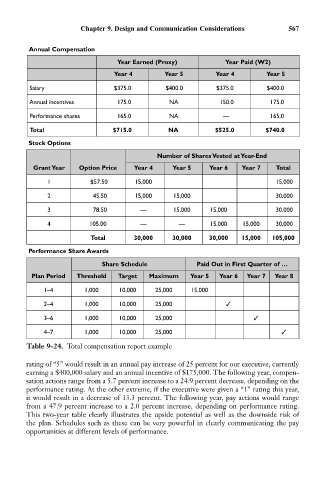
Table 9-24. Total compensation report example
rating of “5” would result in an annual pay increase of 25 percent for our executive, currently
earning a $400,000 salary and an annual incentive of $175,000. The following year, compen-
sation actions range from a 5.7 percent increase to a 24.9 percent decrease, depending on the
performance rating. At the other extreme, if the executive were given a “1” rating this year,
it would result in a decrease of 13.3 percent. The following year, pay actions would range
from a 47.9 percent increase to a 2.0 percent increase, depending on performance rating.
This two-year table clearly illustrates the upside potential as well as the downside risk of
the plan. Schedules such as these can be very powerful in clearly communicating the pay
opportunities at different levels of performance.