
Page 159 - The Geological Interpretation of Well Logs
P. 159
- THE NEUTRON LOG -
coal
shale Ba 45 NEUTRON 3, POROSITY, (limestone),
silt
TTT TT
Ct
sand fi. 1! II
BULK DENSITY g/cm?
2.2
2.7
1.7
TC
T_
U
$s
silt
- ana
€
om
silty shale 2
%
3
cu shale be
sequence sl. silty =
: '
Om
os
shale /
coal
silt a
silty shale q
shale
CU sequence sl. silty &
\ shale
= 20m
coal
APPROX. CNL POROSITY {sandstone}
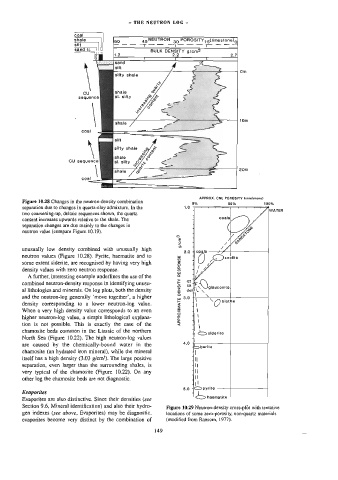
Figure 10.28 Changes in the neutron-density combination
0% 50% 100%
—-—r
separation due to changes in quartz-clay admixture. In the 4.0
——
T
r
T
T
WATER
two coarsening-up, deltaic sequences shown, the quartz
coals
content increases upwards relative to the shale. The
Los
separation changes are due mainly to the changes in
neutron value (compare Figure 10.19).
g/cm? pa
unusually low density combined with unusually high
nN o 1 o D o @
q
\
neutron values (Figure 10.28). Pyrite, haematite and to
some extent siderite, are recognised by having very high RESPONSE
density values with zero neutron response.
A further, interesting example underlines the use of the
DENSITY uN glauconite
combined neutron-density response in identifying unusu- PO)
al lithologies and minerals. On log plots, both the density
_|— c
|
\ ‘
and the neutron-log generally ‘move together’, a higher
APPROXIMATE
density corresponding to a lower neutron-log value. —_— ‘O biotite
When a very high density value corresponds to an even
higher neutron-log value, a simple lithological explana- def \
tion is not possible. This is exactly the case of the \ \
chamosite beds common in the Liassic of the northem
2 siderite
North Sea (Figure 10.22), The high neutron-log values
are caused by the chemically-bound water in the 4.0
\
chamosite (an hydrated iron mineral), while the mineral
i
itself has a high density (3.03 g/cm?). The large positive
gos
separation, even larger than the surrounding shales, is
very typical of the chamosite (Figure 10.22). On any <—_> haematite
other log the chamosite beds are not diagnostic.
&.0 i> pyrite
Evaporites
Evaporites are also distinctive. Since their densities (see
Section 9.6, Minera] identification) and also their hydro- Figure 10.29 Neutron-density cross-plot with tentative
gen indexes (see above, Evaporites) may be diagnostic, locations of some zero-porosity, non-quartz materials
evaporites become very distinct by the combination of 149 {modified from Ransom, !977).