
Page 158 - The Geological Interpretation of Well Logs
P. 158
- THE GEOLOGICAL INTERPRETATION OF WELL LOGS -
) =15
42 36 30 24 78 12 #6 Oo -6 -12
rT ae yp toe
shale
SANOSTONE f°:
| -ve separation
15% |°:
LIMESTONE
$15%
DOLOMITE
$15%
shale
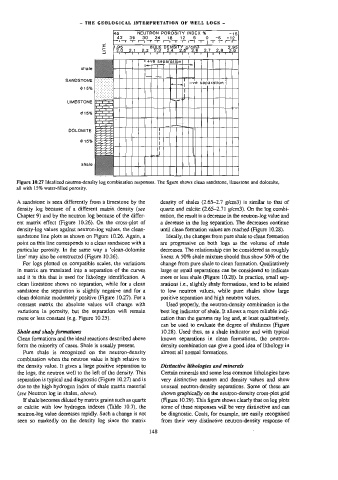
Figure 10.27 Idealized neutrop-density log combination responses. The figure shows clean sandstone, limestone and dolomite,
all with 15% water-filled porosity.
A sandstone is seen differently from a limestone by the density of shales (2.65-2.7 g/cm3) is similar to that of
density log because of a different matrix density (see quartz and calcite (2.65-2.71 g/cm3). On the log combi-
Chapter 9) and by the neutron log because of the differ- nation, the result is a decrease in the neutron-log value and
ent matrix effect (Figure 10.26). On the cross-plot of a decrease in the log separation. The decreases continue
density-log values against neutron-log values, the clean- until clean formation values are reached (Figure 10.28).
sandstone line plots as shown on Figure 10.26. Again, a Ideally, the changes from pure shale to clean formation
point on this line corresponds to a clean sandstone with a are progressive on both logs as the volume of shale
particular porosity. In the same way a ‘clean-dolomite decreases. The relationship can be considered as roughly
line’ may also be constructed (Figure 10.26). linear. A 50% shale mixture should thus show 50% of the
For logs plotted on compatible scales, the variations change from pure shale to clean formation. Qualitatively
in matrix are translated into a separation of the curves large or small separations can be considered to indicate
and it is this that is used for lithology identification. A more or less shale (Figure 10.28). In practice, small sep-
clean limestone shows no separation, while for a clean arations i.e., slightly shaly formations, tend to be related
sandstone the separation is slightly negative and for a to low neutron values, while pure shales show large
clean dolomite moderately positive (Figure 10,27). For a positive separation and high neutron values.
constant matrix the absolute values will change with Used properly, the neutron-density combination is the
variations in porosity, but the separation will remain best log indicator of shale. It allows a more reliable indi-
more or less constant (e.g. Figure 10.25). cation than the gamma ray log and, at least qualitanvely,
can be used to evaluate the degree of shaliness (Figure
Shale and shaly formations 10.28). Used thus, as a shale indicator and with typical
Clean formations and the ideal reactions described above known separations in clean formations, the neutron-
form the minority of cases. Shale is usually present. density combination can give a good idea of lithology in
Pure shale is recognized on the neutron-density almost al] normal formations.
combination when the neutron value is high relative to
the density value. It gives a large positive separation to Distinctive lithologies and minerals
the logs, the neutron well to the left of the density. This Certain minerals and some less common lithologies have
separation is typica] and diagnostic (Figure 10.27) and is very distinctive neutron and density values and show
due to the high hydrogen index of shale matrix material unusual neutron-density separations. Some of these are
(see Neutron log in shales, above). shown graphically on the neutron-density cross-plot grid
If shale becomes diluted by matrix grains such as quartz (Figure 10.29), This figure shows clearly that on log plots
or calcite with low hydrogen indexes (Table 10.7), the some of these responses will be very distinctive and can
neutron-log value decreases rapidly. Such a change is not be diagnostic. Coals, for example, are easily recognised
seen so markedly on the density log since the matrix from their very distinctive neutron-density response of
148