Page 153 - The Geological Interpretation of Well Logs
P. 153

-  THE  NEUTRON  LOG  -

       1974).  The  same  result  is  obtained  on  the  admixcure  of
      any  materia)  with  a  very  low  hydrogen  index  with  clays.
      This  may  be  quartz  as  above,  limestone,  dolomite  or
                                                                       COMPACTION  DISPLACEMENT
      certain  evaporites:  the  lower  the  clay  volume  the  lower   deep  <}-—-(1  100m)      shallow

      the  neutron  log  vatue.                                                Qo
                                                                               oO
        Entirely  the  reverse  effect  is  caused  by  the  admixture         fe
                                                                  204          on
      of  organic  matter  with  clays:  it  causes  an  increase  in  the
      hydrogen  index.  This  is  because  organic  matter  has  a
                                                                               shallow
      higher  hydrogen  abundance  per  unit  volume  (hydrogen
      index  around  0.66)  than  clay  (Table  10.8)  (Figure  10.20).   4          28  5m
                                                                 Rx
      The  increase  in  neutron  log  values  with  organic  matter  is   >
                                                                 Q
      notable,  especially  when  combined  with  the  attendant   Zz
                                                                 5
      decrease  in  butk  density  (see  Figure  9.18).          Oo  10-
                                                                 wi
        One  aspect  in  the  evaluation  of  shales  with  neutron   x
                                                                 mh
      tools  which  does  not  seem  to  have  been  evaluated
      sufficiently,  is  the  effect  of  thermal  neutron  absorbers.   ]                   )
      Capture  and  absorption  in  pore  space  liquids  are  mainly
      due  to  hydrogen  and  chlorine  (NaCl)  which  are  corrected   0
      for  in  too]  response.  Capture  in  the  solid  matrix  is
      negligible  unless  it  contains  elements  with  unusually  high
                                                                    1       30      46     60
      capture  cross-sections,  such  as  boron  or  gadolinium       NEUTRON  POROSITY  UNITS  %
                                                                            (log  values)
      (Table  10.3).  Boron  content  has  been  examined  in  the
      Gulf  Coast  and  is  said  have  a  noticeable  effect  in  certain
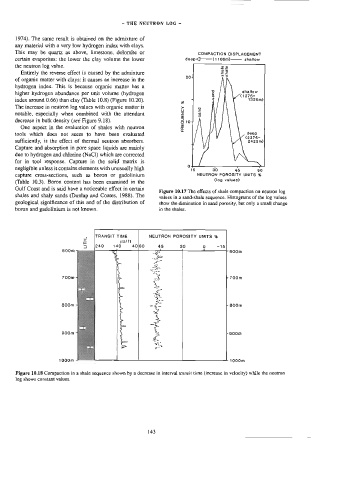
                                                         Figure  10.17  The  effects  of  shale  compaction  on  neutron  log
      shales  and  shaly  sands  (Dunlap  and  Coates,  1988).  The
                                                         values  in  a  sand-shale  sequence,  Histograms  of  the  log  values
      geological  significance  of  this  and  of  the  distribution  of   show  the  diminution  in  sand  porosity,  but  only  a  smal]  change
      boron  and  gadolinium  is  not  known.            in  the  shales.

                                   TRANSIT  TIME     NEUTRON  POROSITY  UNITS  %
                               LITH.   240   140  BS/ft   40/60

                                                                             -15
                                                                        9
                                                                30
                       600m                                                       600m
                                                                         ,
                                                         =
                                        4
                                         q
                       700m                                                      r  700m


                       800m                                                      -  800m


                       300m                                                      soon


                      1000m                                                        1000m

       Figure  16.18  Compaction  in  a  shale  sequence  shown  by  a  decrease  in  interval  transit  time  (increase  in  velocity)  while  the  neutron
       log  shows  constant  values.


                                                     143
   148   149   150   151   152   153   154   155   156   157   158