
Page 152 - The Geological Interpretation of Well Logs
P. 152
- THE GEOLOGICAL INTERPRETATION OF WELL LOGS -
density-neutron porosity indicates the limit of the inter-
layer water (Figure 10.16).
This theoretical behaviour of water in clay formations
NEUTRON POROSITY UNITS %
45 a 8 0 (Figure 10.16) is difficult to see on the neutron logs. In a
Om typical well of 3000 m there is a gradual diminution of
L
=>
4
1
L
L
4
L
1
1
1
4
4
1
1
~~ the average neutron shale value (Figure 10.17}. This is
=~.
presumably the compaction effect yet it is surprisingly
— =”
TL smal] when the theoretical diminution of water content
sand ea, with depth is considered. Frequently, when compaction is
Ss
<_> —_—~ indicated on other logs (for example the sonic) the neu-
=
shale tron log value remains constant (Figure 10.18). A verified
7 26m
explanation of these phenomena has yet to be found, but
they suggest that the bulk water content of a clay, as seen
—
ua"
> > by the neutron, remains constant, while its distribution
“a
S,
sally -" between pore-water, adsorbed water and interlayer water
sand > changes. Pore-water should diminish with compaction.
“= 2
50m Neutron log in shales: composition
re
—7
— —_— Even though there are differences in the amounts of com-
2
= =a bined water and neutron log value between the
=F the proportions of these in natural shales seem to have
different clay mineral species (Table 10.8), variations in
SF
——
=
little effect on the neutron log. Variations in non-clay
minerals are much more noticeable and they dominate the
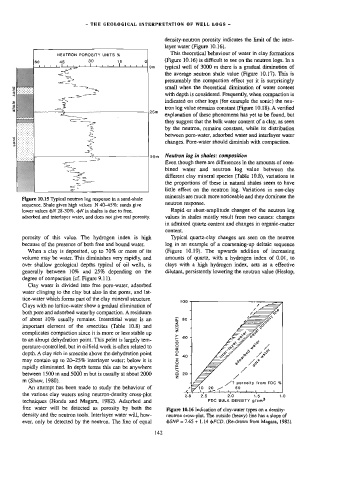
Figure 10.15 Typical neutron log response in a sand-shale
neutron response.
sequence. Shale gives high values N 40-45%: sands give
lower values bN 28-30%. oH in shales is due to free, Rapid or short-amplitude changes of the neutron log
adsorbed and interlayer water, and does not give real porosity. values in shales mostly result from two causes: changes
in admixed quartz content and changes in organic-matter
content.
porosity of this value. The hydrogen index is high Typical quartz-clay changes are seen on the neutron
because of the presence of both free and bound water. log in an example of a coarsening-up deltaic sequence
When a clay is deposited, up to 70% or more of its (Figure 10.19). The upwards addition of increasing
volume may be water. This diminishes very rapidly, and amounts of quartz, with a hydrogen index of 0.0!, to
over shallow geological depths typical of oi! wells, is clays with a high hydrogen index, acts as a effective
generally between 10% and 25% depending on the dilutant, persistently lowering the neutron value (Heslop,
degree of compaction (cf. Figure 9.11).
Clay water is divided into free pore-water, adsorbed
water clinging to the clay but also in the pores, and lat-
tice-water which forms part of the clay mineral structure.
100
Clays with no lattice-water show a gradual elimination of f
4 /
both pore and adsorbed water by compaction. A residuum / Re
of about 10% usually remains. Interstitial water is an = 80 - Ze mS
z oO
important element of the smectites (Table 10.8) and a | e
R a
complicates compaction since it is more or less stable up
> 2 Oo
7 60-4 eo?
to an abrupt dehydration point. This point is largely tem-
a <. e
perature-controlled, but in oilfield work is often related to
7 > os
depth. A clay rich in smectite above the dehydration point @ $ @ x
& 40 4 < es 7
May contain up to 20-25% interlayer water: below it is S z 2 % Js
rapidly eliminated. In depth terms this can be anywhere Ee xc 7 LA gz
>
between 1500 m and 5000 m but is usually at about 2000 a 20 +
z /
m (Shaw, 1980).
4 ve porosity from FDC %
An attempt has been made to study the behaviour of ? 10 20 _” 5a
4 < 1 r agle _d L. 1 y 1 1
the various clay waters using neutron-density cross-plot
2.8 2.5 2.0 1.5 1.0
techniques (Honda and Magara, 1982). Adsorbed and FDC BULK DENSITY g/cm?
free water will be detected as porosity by both the Figure 10.16 Indication of clay-water types on a density-
density and the neutron tools. Interlayer water will, how- neutron cross-plot. The outside (heavy) line has a slope of
ever, only be detected by the neutron. The line of equal 142 SNP = 7.65 + 1.14 bFCD. (Re-drawn from Magara, 1982).