
Page 148 - The Geological Interpretation of Well Logs
P. 148
- THE GEOLOGICAL INTERPRETATION OF WELL LOGS -
neutron phi (d} rho bulk
. gamma ray {i.e. neutron porosity?) (i.e. bulk density)
bit size API units scale 1 div. 3 units) scale 1 div. 0.05 g/cm3
cable tension
TENS(LE
{A) delta rho
(i.e. density
caliper RHOE (6/C% corrections)
(Z.706/Cm%)
-o— neutron
“| +back-up
tension log
{about 2200 Ibs)
density correction
(about 0.05 g/cm)
CAL
DENSITY LOG
NEUTRON POROSITY
&
OG
°
L
(reading about ¢r eading about
2.37 g/om)
40 units)
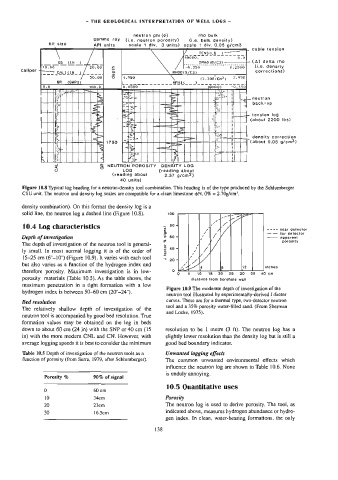
Figure 10.8 Typical log heading for a neutron-density tool combination. This heading is of the type produced by the Schlumberger
CSU unit. The neutron and density log scales are compatible for a clean limestone oN, 0% = 2.70g/cem?.
density combination). On this format the density log is a
solid line, the neutron log a dashed line (Figure 10.8). 400
- ee
o ° 4
Te
.? Sf.
10.4 Log characteristics a 4 7
---- near detector
&
Z /
—— far detector
Depth of investigation v * 60- 7 apparent
/
porosity
The depth of investigation of the neutron toal is general- » 4
3 2 40 - ;
ly smal]. In most normal logging it is of the order of
£ 3S / i V /
15-25 cm (6"-10") (Figure 10.9). It varies with each tool
> 205 y r /
but also varies as a function of the hydrogen index and “‘y
A
o ats | bb | be | dienes
h
therefore porosity. Maximum investigation is in low-
0 5 40 168 #20 25 30 35 40cm
porosity materials (Table 10.5). As the table shows, the distance from borehole wall
maximum penetration in a ght formation with a low
Figure 10.9 The moderate depth of investigation of the
hydrogen index is between 50-60 cm (20"-24").
neutron tool illustrated by experimentally-derived J-factor
curves. These are for a thermal type, two-detector neutron
Bed resolution
tool and a 35% porosity water-filled sand. (From Sherman
The retatively shallow depth of investigation of the
and Locke, 1975).
neutron tool is accompanied by good bed resolution. True
formation values may be obtained on the log in beds
down to about 60 cm (24 in) with the SNP or 40 cm (15 resolution to be 1 metre (3 ft). The neutron log has a
in) with the more modern CNL and CN. However, with slightly lower resolution than the density log but is still a
average logging speeds it is best to consider the minimum good bed boundary indicator.
Table 10.5 Depth of investigation of the neutron tools as a Unwanted logging effects
function of porosity (from Serra, 1979, after Schiumberger). The common unwanted environmental effects which
influence the neutron log are shown in Table 10.6. None
is unduly annoying.
Porosity % 90% of signal
10.5 Quantitative uses
0 60 cm
10 34cm Porosity
20 23em The neutron log is used to derive porosity. The tool, as
indicated above, measures hydrogen abundance or hydro-
30 16.5cm
gen index. In clean, water-bearing formations, the only
138