
Page 151 - The Geological Interpretation of Well Logs
P. 151
- THE NEUTRON LOG -
190.00
90.00
90.00
10.00
API SHALE
RAY 61.00
50.00 SHALY
GAMMA, 49.00 SAND
49.00 =e
CLEAN
20.00
14.0
NEUTRON POROSITY
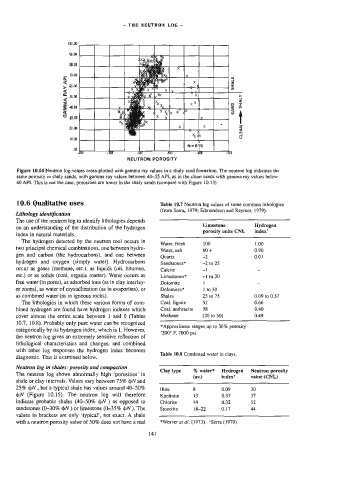
Figure 10.14 Neutron log values cross-plotted with gamma ray vatues in a shaly sand formation. The neutron tog indicates the
same porosity in shaly sands, with gamma ray values between 40-55 API, as in the clean sands with gamma ray values below
40 API. This is not the case, porosities are lower in the shaly sands (compare with Figure 10.13).
10.6 Qualitative uses Table 10.7 Neutron log values of some common lithologies
(from Serra, 1979; Edmundson and Raymer, 1979).
Lithology identification
The use of the neutron log to identify lithologies depends
: 5 petit Limestone Hydrogen
on an understanding of the distribution of the hydrogen porosity ne ONE imtext
index in natural materials.
The hydrogen detected by the neutron tool occurs in Water, fresh 100 1.00
two principal chemical combinations, one between hydro- Water, salt 60 + 0.90
gen and carbon (the hydrocarbons), and one between Quartz 2 0.01
hydrogen and oxygen (simply water). Hydrocarbons Sandstones* -2 to 25
occur as gases (methane, etc.), as liquids (oil, bitumen, Calcite -I .
etc.) or as solids (coal, organic matter). Water occurs as Limestones* -) to 30
free water (in pores), as adsorbed ions (as in clay interlay- Dolomite ] _
er zones), as water of crystallization (as in evaporites), or Dolomites* 1 to 30
as combined water (as in igneous rocks). Shales 25 to 75 0.09 to 0.37
The lithologies in which these various forms of com- Coal. lignite 52 0.66
bined hydrogen are found have hydrogen indexes which Coal, anthracite 38 0.40
cover almost the entire scale between ] arid 0 (Tables Methane (20 to 50) 0.49
10.7, 10.8). Probably only pure water can be recognized
* Approximate ranges up to 30% porosity
categorically by its hydrogen index, which is 1. However,
200° F, 7000 psi
the neutron log gives an extremely sensitive reflection of
lithological characteristics and changes, and combined
with other log responses the hydrogen index becomes
Table 10.8 Combined water in clays.
diagnostic. This is examined below.
Neutron log in shales: porosity and compaction
The neutron log shows abnormally high ‘porosities’ in Clay type ow ee snp haend
shale or clay intervals. Values vary between 75% oN and :
25% oN , but a typical shale has values around 40-50% Illite g 0.09 30
oN (Figure 10.15). The neutron log will therefore Kaolinite 13 0.37 37
indicate probable shales (40-50% NV ) as opposed to Chlorite 14 0.32 52
sandstones (0-30% <bN or limestone (0-35% oN ). The Smectite 18-22 0.17 44
)
values in brackets are only ‘typical’, not exact. A shale
with a neutron porosity value of 50% does not have a real 141 *Weaver et al. (1973) *Serra (1979)