
Page 149 - The Geological Interpretation of Well Logs
P. 149
~ THE NEUTRON LOG -
Table 10.6 Unwanted environmental effects — neutron log. This latter method is especially useful in limestones and
dolomites.
Factor Effect on log *Severity
Hydrocarbon effects on neutron porosity
The rules governing the relationship between neutron-log
Hole rugosity Increase (normally) in
and caving ¢ neutron-to read mud Common porosity and the true porosity in clean formations are
valid when either water or oil fill the pores (the two fluids
Mud salinity | Automatically corrected - have essentially the same hydrogen index). However, gas
most effect on thermal having a very low density, has a very low hydrogen
neutron detectors Rare index compared to water. The presence of gas makes the
neutron log give too low a porosity (Figure 10.12).
Temperature Automatically corrected
Corrections for gas content can be made (Gaymard and
and pressure in each individual run Rare
Poupon, 1968) but the best use of this phenomenon is
qualitative. Moreover, on the neutron-density combina-
*When the effect makes the log reading unusable.
tion (see below) gas stands out very distinctly, giving a
Ratings: frequent, common present, rare.
large negative separation (Figure 10.12).
hydrogen present is in the formation water (H,O). The
neutron tool therefore responds to the volume of water-
filled pore space, and gives a measure of the porosity.
3
Expressed mathematically,
1B00--
log,, b= aN + B
16.00-
where ¢ is the true porosity, a, B are constants, and N is
4 20r
the neutron-too] reading.
However, calibration is necessary for the above calcu- *%
CORE POROSITY
lation as matrix materials have differing effects on the
neutron log which change with porosity. A water-filled 19,007-
sandstone with 20% porosity gives a different neutron-
log reading to water-filled limestone with 20% porosity +. “and OROER BEST FIT LINE 2
:
H- BOAS > $380 Cricy * O78 Orr sy
(Figure 10.10). Alternatively, if very accurate results are
required, for example in a field study, the neutron log
porosities can be compared to measured core porosities 4.00
(Figure 10.11). The empirical calibration allows zones
not cored to be accurately and confidently interpreted. 220
L
1
4
4
1
4
1
4
1
4m ogo 400 8.00 12.00 16.00 2.00 24,00 2400 30 300
COMPENSATEO NEUTRON LIMESTONE POROSITY &
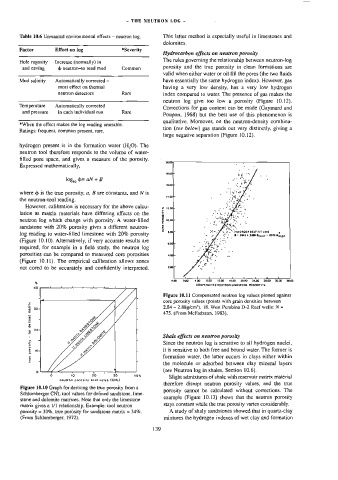
Figure 10.11 Compensated neutron log values plotted against
core porosity values (points with grain densities between
matrix 2.84 - 2.88g/cm’). 18, West Pembina D-2 Reef wells: V =
475. (From McFadzean, 1983).
dellned
tor
— Shale effects on neutron porosity
poresily Since the neutron log is sensitive to all hydrogen nuclei,
it is sensitive to both free and bound water. The former is
the molecule or adsorbed between clay mineral layers
true formation water, the latter occurs in clays either within
(see Neutron log in shales, Section 10.6).
T
20 30 40%
Slight admixtures of shale with reservoir matrix material
neutron porosity tool value (CNL)
therefore disrupt neutron porosity values, and the true
Figure 10.10 Graph for deriving the true porosity from a
porosity cannot be calculated without corrections. The
Schlumberger CNL tool values for defined sandstone, lime-
example (Figure 10.13) shows that the neutron porosity
stone and dolomite matrices. Note that only the limestone
stays constant while the true porosity varies considerably.
matrix gives a 1/1 relationship. Exampte: too] neutron
porosity = 30%, true porosity for sandstone matrix = 34%. A study of shaly sandstones showed that in quartz-clay
(From Schlumberger. 1972). mixtures the hydrogen indexes of wet clay and formation
139