
Page 150 - The Geological Interpretation of Well Logs
P. 150
~ THE GEOLOGICAL INTERPRETATION OF WELL LOGS -
>
A oO
o
3 BULK DENSITY g/cm? 2.9
cauper | 2 [79, . 72, = te i‘)
NEUTRON POROS! l
E
(inches)
oO 6 "1 45 oe 1 1 { iS 4 1 ) 1 1 7s
bit—7 + sot
size ¥
104 at GAS EFFECT
~ (large negative
£ mua 2 separation)
£ raned tt 5
=“ ‘
220 {
a t
4 | 1
t
307 t |
: l \ ——
i
404
T
B 30
GAS EFFECT /
Cow log’ porosity)
2 S| | 4
ae
> 20
rr we.
° *35e
5 wee
a OF
g wv
&
a 10
S&S
oy
&
wg
o sandstone porasity
0 10 20 30 J line - CNL
neutron porosity units % 30%
(CNL Schlumberger)
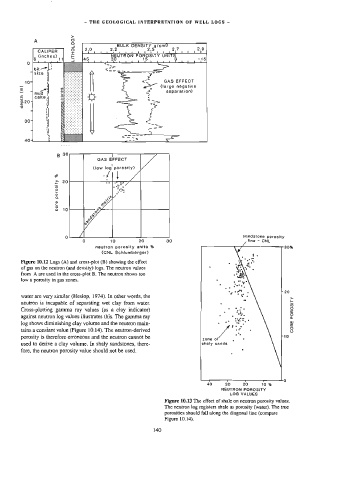
Figure 10.12 Logs (A) and cross-plot (B) showing the effect
of gas on the neutron (and density) logs. The neutron values .
from A are used in the cross-plot B. The neutron shows too
low a porosity in gas zones.
- 20
water are very similar (Heslop, 1974). In other words, the >
neutron is incapable of separating wet clay from water. . 5
Cross-plotting gamma ray values (as a clay indicator) . 2
againsi neutron log values illustrates this. The gamma ray ‘ &
log shows diminishing clay volume and the neutron main- _ &
tains a constant value (Figure 10.14). The neutron-derived oO
porosity is therefore erroneous and the neutron cannot be zone of
used to derive a clay volume. In shaly sandstones, there- shaly sands
fore, the neutron porosity value should not be used.
40 30 20 10 %
NEUTRON POROSITY
LOG VALUES
Figure 10.13 The effect of shale on neutron porosity values.
The neutron log registers shale as porosity (water). The true
porosities should fal] along the diagonal line (compare
Figure 10.14).
140