
Page 157 - The Geological Interpretation of Well Logs
P. 157
- THE NEUTRON LOG -
NEUTRON POROSITY
(limestone matrix) 42 36 30 24 138 12 _ 6 i -~6 -12
so TT ot ee Eee
eS
oe
29
BULK DENSITY 95 2.1 2.2 2.3 g/em 3 2.5 2.6 2,7 2.8 2.9
2.0
2.4
sity
shale
neutron
om
(low porosities)
i f
zero
porosity
limestone
limestone
25m
example:
@N=25
pB=2.28
(high porosities)
som
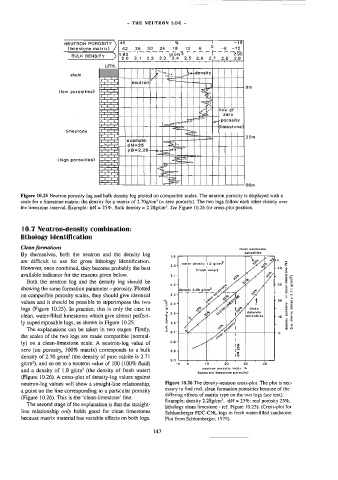
Figure 10.25 Neutron porosity log and bulk density log plotted on compatible scales. The neutron porosity is displayed with a
scale for a limestone matrix: the density for a matrix of 2.70g/cm? (= zero porosity). The two logs follow each other closely over
the limestone interval. Example: @N = 25%. Bulk density = 2.28g/em?. See Figure 10.26 for cross-plot position.
10.7 Neutron-density combination:
lithology identification
Clean formations Cclaan sandstone
porosities
By themselves, both the neutron and the density log 1.9
T
are difficult to use for gross lithology identification. Nee a5
2.94 water density 4.0 gfom? 2 | 2
However, once combined, they become probably the best . ! » . 40
{fresh water} <
se =
available indicator for the reasons given below. 2175 C/E a
@Q %,
se ae
Both the neutron log and the density log should be
2.2 4 $ L 40 5 >
showing the same formation parameter — porosity. Plotted densi op sr
— > b om
on compatible porosity scales, they should give identical 2.39 7 uN
« f b20 =
values and it should be possible to superimpose the two 2 g
E 2.44
logs (Figure 10.25). In practice, this is only the case in o clean - $°
dolomite 3
2 2.84
clean, water-filled limestones which give almost perfect- 3 porosilies hip 2S
$ Ze
ly superimposable logs, as shown in Figure 10.25. 2.6% a.
r 6 Od
The explanations can be taken in two stages. Firstly, $ > ¥| uu
9
Part }
7
the scales of the two logs are made compatible (normal-
ly) on a clean-limestone scale. A neutron-log value of 2.87
zero (no porosity, 100% matrix} corresponds to a bulk 2.94 +
3.0 7
density of 2.70 g/cm? (the density of pure calcite is 2.71
T
g/cm*), and so on to a neutron value of 160 (100% fluid)
30
20
40
10
ageutron poresily index %
and a density of 1.0 g/cm’ (the density of fresh water)
{apparent Nmagione porosity)
(Figure 10.26). A cross-plot of density-log values against
neutron-log values will show a straight-line relationship, Figure 10.26 The density-neutron cross-plot. The plot is nee-
essary to find real, clean formation porosities because of the
a point on the fine corresponding to a particular porosity
differing effects of matrix type on the two logs (see text).
(Figure 10.26), This is the ‘clean-limestone’ line.
Example: density 2.28g/em3, $N = 25%: real porosity 25%,
The second stage of the explanation is that the straight-
lithology clean limestone - (cf. Figure 10.25). (Cross-plot for
line relationship only holds good for clean limestones
Schlumberger FDC-CNL logs in fresh water-filled sandstone.
because matrix material has variable effects on both logs. Plot from Schlumberger, 1979).
147