
Page 165 - The Geological Interpretation of Well Logs
P. 165
- LITHOLOGY RECONSTRUCTION FROM LOGS -
SIDEWALL SAMPLE LOGS
2 At
SIDEWALL SIDEWALL
19590 g
SAMPLER CORE
2.6cm
~_ | <
—_—___\_—__
LL
T
I
OM
Jf tt
sample depth »
grey-brown
micaceous
—
—
claystone
LITH. LOGS
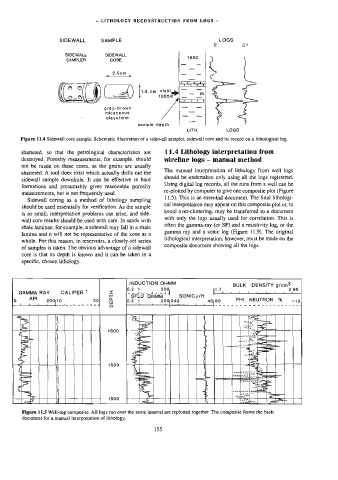
Figure 11.4 Sidewall core sample. Schematic illustration of a sidewall sampler, sidewall core and its record on a lithological fog.
shattered, so that the petrological characteristics are 11.4 Lithology interpretation from
destroyed. Porosity measurements, for example, should wireline logs — manual method
not be made on these cores, as the grains are usually
The manual interpretation of lithology from well logs
shattered. A tool does exist which actually drills out the
should be undertaken only using all the logs registered,
sidewall sample downhole. It can be effective in hard
Using digital log records, all the runs from a well can be
formations and presumably gives reasonable porosity
re-plotted by computer to give one composite plot (Figure
measurements, but is not frequently used.
11.5). This is an essential document. The final lithologi-
Sidewall coring as a method of lithology sampling
cal interpretation may appear on this composite plot or, to
should be used essentially for verification. As the sample
avoid over-cluttering, may be transferred to a document
is so small, interpretation problems can arise, and side-
with only the logs usually used for correlation. This is
wall core results should be used with care. In sands with
often the gamma-ray (or SP) and a resistivity log, or the
shale laminae, for example, a sidewall may fall in a shale
gamma ray and a sonic log (Figure 11.9). The original
lamina and it will not be representative of the zone as a
lithological interpretation, however, must be made on the
whole. For this reason, in reservoirs, a closely-set series
composite document showing all the logs.
of samples is taken. The obvious advantage of a sidewall
core is that its depth is known and it can be taken in a
specific, chosen lithology.
INDUCTION OHMM
BULK DENSITY g/cm?
200) 2.95
GAMMA RAY CALIPER ” |j=e- a ws ee de ewe
SFLU OHMM SONIC #/ft
API NEUTRON %
0 10 20 21 2 240 4 PHI
ek
awertye
eke
-t
1900
Figure 11.5 Well-log composite. All togs run over the same interval are replotted together. The composite forms the basic
document for a manual interpretation of lithology.
155