
Page 166 - The Geological Interpretation of Well Logs
P. 166
- THE GEOLOGICAL INTERPRETATION OF WELL LOGS ~
Horizontal routine mud log or sidewall samples. A check with the SP shows
There are no simple rules for the quick manual interpre- that the neutron-density indicated sand intervals corre-
tation of lithology from logs — if there were, this account spond to permeable zones, and that in turn these have
would be superfluous. This book outlines the capabilities mud-cake indicated by the caliper. The anomalous log,
and characteristics of each of the openhole tools. To therefore, is the gamma-ray. From the interpretation it
interpret lithology, these capabilities and characteristics can be concluded that the sandstones have a high gamma
must be known and used, A systematic approach is best. ray count because of included feldspars, micas or other
Thus, the gross lithology is suggested by the mud log, this non-shale radioactive elements. The manual interpretation
can then be corroborated and compared at the same should find a compatible explanation for the reactions of
depth, horizontally, to a simple log such as the gamma all the logs.
ray or the SP (Figure 11.6,2). The interpretation is then
‘continued, again horizontally, through the other logs - Vertical routine
resistivity, sonic and density-neutron. If all corroborate Although the horizontal routine is the basis for any litho-
the same interpretation, the jithology can be noted and logical interpretation, individual logs should also be
then compared to sidewall cores or other samples (Figure examined vertically for trends, baselines or, absolute
11.6,3). Lf the lithology is not corroborated, then there values. For the gamma ray log, for instance, and also the
must be a ‘feedback’ from one log to the next, The first SP, a shale baseline can be drawn but also a minimum,
aspect to check is that of log quality. The hole may be clean sand? limestone? etc., line for the gamma ray and
very caved, one or more of the logs may be badly record- a maximum deflection (SSP) for the SP - (see Chapter 6
ed, and hence the readings are anomalous. These aspects for the gamma ray and Chapter 5 for the SP) (Figure
are considered in the chapters on the individual tools. 11.7).
However, the anomaly may be within the Sithology itself. Instead of a line, colour may be used. The caliper may
For example, in a sand-shale sequence, there may be be coloured to give caves and mud-cake zones. The
40% sand and 60% shale marked on the mud log. The density-neutron combination, if the logs are plotted on
gamma ray Jog may read persistently high, so that only compatible scales (Chapter 10), can be coloured to under-
shale is suspected. The resistivity log and the sonic log line curve separations (Figure 11.7). The latter is an
are not diagnostic, but the density-neutron combination excellent lithology indicator, as has been described in
shows that it is either sandstone, limestone or dolomite: Chapters 9 and 10. Thus, a cestain amount of preparation
sandstone is indicated from the mud log. The sandstones of the composite plot in the vertical sense can aid in the
are then marked on the lithology log and compared to the horizontal routines.
NEUTRON %
GAMMA RAY API
ic0
sidewall
CUTTINGS CALIPER (diff.) ” cores
% 100 Q
LOGS)
(ALL
2425m
ew Ales ert
ee
=
y
@
=> build ©
~t——-reiteratlon
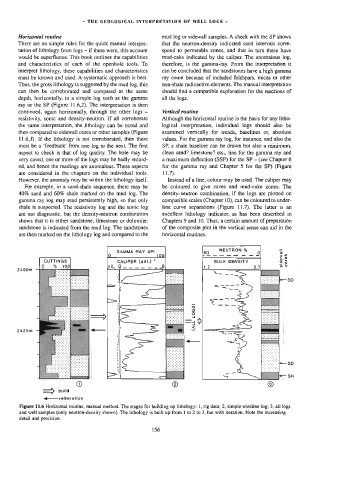
Figure 11.6 Horizontal routine, manual method. The stages for building up lithology: 1, rig data; 2, simple wireline log; 3, all logs
and well samples (only neutron-density shown), The lithology is built up from 1 to 2 to 3, but with iteration. Note the increasing
detail and precision.
156