
Page 169 - The Geological Interpretation of Well Logs
P. 169
- LITHOLOGY RECONSTRUCTION FROM LOGS -
COMPLETION LOG WELL: X
GAMMA RAY SONIC p/ft DESCRIPTION
0 API 180) “ITH. lao 45
7 Huo ir,
“eres A ‘ 90% c1 = interbeds of:
za] ESS l ~SANDSTONE,
a = z fine-grained, mic. org]
2386m __ ir, | -CLAY, grey
Poe
q SD fe: * -COAL
—t = ~
” o
oO Lee (OL |
- PE
BATHONIAN
o +
wo casing | FE
|
a5
8
<= 2 oO
ec
2
> LVS
—
2427m-2640m
TOP ’MASSIVE
SAND FORMATION’
SANOSTONE grey-brown
90% rec.
ne
medium-coarseé or.
porous, oll & gas shows
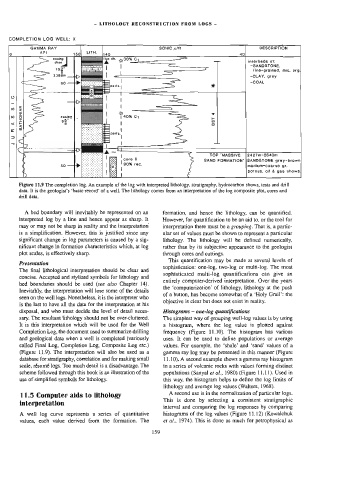
Figure 11.9 The completion log, An example of the log with interpreted lithology, stratigraphy, hydrocarbon shows, tests and drilt
data. It is the geologist’s ‘basic record’ of a well. The lithology comes from an interpretation of the log composite piot, cores and
drill data.
A bed boundary will inevitably be represented on an formation, and hence the lithology, can be quantified.
interpreted log by a line and hence appear as sharp. It However, for quantification to be an aid to, or the tool for
may or may not be sharp in reality and the interpretation interpretation there must be a grouping. That is, a partic-
is a simplification. However, this is justified since any ular set of values must be shown to represent a particular
significant change in log parameters is caused by a sig- lithology. The lithology will be defined numerically,
nificant change in formation characteristics which, at log rather than by its subjective appearance to the geologist
plot scales, is effectively sharp. through cores and cuttings.
This quantification may be made at several levels of
Presentation
sophistication: one-log, two-log or multi-log. The most
The final lithological interpretation should be clear and
sophisticated multi-log quantifications can give an
concise. Accepted and stylized symbols for lithology and
entirely computer-derived interpretation. Over the years
bed boundaries should be used (see also Chapter 14).
the ‘computerization’ of lithology, lithology at the push
Inevitably, the interpretation will lose some of the details
of a button, has become somewhat of a ‘Holy Grail’: the
seen on the well logs. Nonetheless, it is the interpreter who
objective is clear but does not exist in reality.
is the last to have all the data for the interpretation at his
disposal, and who must decide the level of detail neces- Histograms — one-log quantifications
sary. The resultant lithology should not be over-cluttered. The simplest way of grouping well-log values is by using
It is this interpretation which will be used for the Well a histogram, where the log value is plotted against
Completion Log, the document used to summarize drilling frequency (Figure 11.10). The histogram has various
and geological data when a well is completed (variously uses. It can be used to define populations or average
called Final Log, Completion Log, Composite Log etc.) vaJues. For example, the ‘shale’ and ‘sand’ values of a
(Figure 11.9). The interpretation will also be used as a gamma ray log may be presented in this manner (Figure
database for stratigraphy, correlation and for making smal] 11.10), A second example shows a gamma ray histogram
scale, résumé logs. Too much detail is a disadvantage. The in a series of volcanic rocks with values forming distinct
scheme followed through this book is an illustration of the populations (Sanyal e7 a/., 1980) (Figure 11.11). Used in
use of simplified symbols for lithology. this way, the histogram helps to define the log limits of
lithology and average log values (Walters, 1968).
A second use is in the normalization of particular togs.
11.5 Computer aids to lithology
This is done by selecting a consistent stratigraphic
interpretation
interval and comparing the log responses by comparing
A well log curve represents a series of quantitative histograms of the log values (Figure 11.12) (Kowalchuk
values, each value derived from the formation. The 159 et al., 1974). This is done as much for petrophysical as