
Page 173 - The Geological Interpretation of Well Logs
P. 173
- LITHOLOGY RECONSTRUCTION FROM LOGS -
Often empirical relationships become evident which shale-sandstone mixture. Each log is showing the volume
otherwise would remain hidden. of shale in its own way. Through this straight-line region,
Plotting the gamma ray log values against the neutron changes in porosity typically involve changes in shale
log values, for example (Figure 11.19) brings out several content (possibly related to grain size changes). However,
relationships (Rider ef af, 1979). There is a consistent, in the very clean sandstones there are variations in poros-
straight-line relationship between the two where both ity which do not involve shale and the relationship
the gamma ray and the neutron logs are reacting to a between the two logs changes. In the example (Figure
11.49) the sands are gas filled and the changes in
porosity affect the neutron considerably, diminishing it
as porosity increases. On the gamma ray alone these
changes are not seen: when the logs are plotted together
the relationship becomes evident (cf. Heslop, 1974),
On this same plot (Figure 11.19), at higher gama ray
and neutron values there is also a relationship break. It is
due to organic matter. Since the neutron tool reacts to ail
hydrogen present (Chapter 10), it reacts to the hydrogen
combined with carbon in organic matter (a solid hydro-
carbon). In the exampte, the organic matter is mostly coaj
and lignite grains with low radioactivity. Thus, while the
gamma ray values diminish as the organic matter replaces
the shale, the neutron values increase or remain high
(Rider e7 ai., 1979).
This neutron-gamma ray plot, in fact, is very useful for
analysing shale changes in generat. Condensed sequences
with a high uranium content (Chapter 7) for example,
will fall outside the straight line field: the gamma ray will
be affected (increasing) but the neutron log unaffected
@-+- lithofacies
(or increasing). Textural and wel] as compositional
data point
differences can be brought out: the neutron log increasing
in higher shale porosities, the gamma ray being insensi-
Figure 11.17 3D cross plot density-neutron-thorium, attempts
to show the inter-relationships between the three components. tive. As suggested, plotting incompatible logs brings out
Selected lithofacies points are indicated. (From Baldwin, 1990). relationships which are often geologically significant.
ray
gamma
Hees
induction resistivity —<n
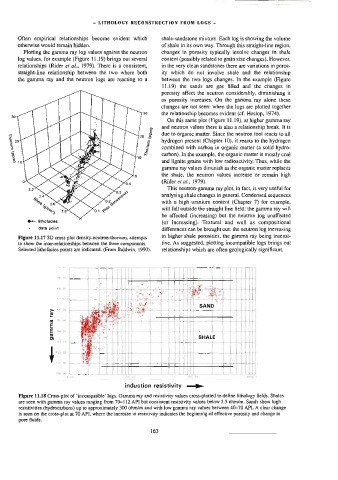
Figure 11.18 Cross-plot of ‘incompatible’ logs. Gamma ray and resistivity values cross-plotted to define lithology fields. Shales
are seen with gamma ray vatues ranging from 70-112 API but consistent resistivity values below 2.5 ohm/m. Sands sbow high
resistivities (hydrocarbons) up to approximately 300 ohm/m and with low gamma ray values between 40-70 API. A clear change
is seen on the cross-plot at 70 API, where the increase in resistivity indicates the beginning of effective porosity and change in
pore fluids, 163