
Page 176 - The Geological Interpretation of Well Logs
P. 176
- THE GEOLOGICAL INTERPRETATION OF WELL LOGS -
LITHOLOGIC POROSITY AND FLUIDS FORMATION
DEPTH FLUID ANALYSIS
CHARACTERISTICS BULK VOLUME *®BULK VOLUME
SHALE % BULK VOLUME WATER SATURATION CLAY QTZ | POROS
0 100] 100 %
PERMEABILITY INDEX | HYOROCARBON VOLUME [fe
$*Shr 0.25
HYDROCARBON WEIGHT
$*Sn* Py,
( - )Bit Size
permpoam ror
-4 0 12
ZONE OF
INTEREST
x
at
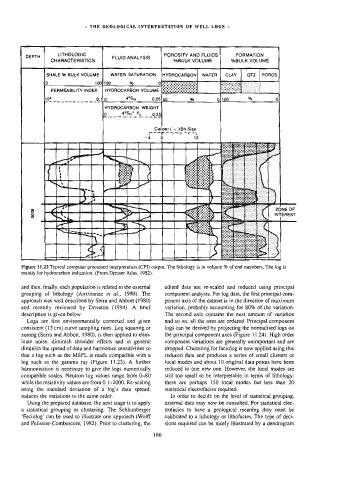
Figure 11.22 Typical computer processed interpretation (CPI) output. The lithology is in volume % of end members. The log is
mainly for hydrocarbon indication. (From Dresser Atlas, 1982).
and then, finally, each population is related to the external edited data are re-scaled and reduced using principal
grouping of lithology (Anxionnaz ef ai., 1990). The component analysis. For log data, the first principal com-
approach was well described by Serra and Abbott (1980) ponent axis of the dataset is in the direction of maximum
and recently reviewed by Doveton (1994). A bref variation, probably accounting for 80% of the variation.
description is given below. The second axis contains the next amount of variation
Logs are first environmentally corrected and given and so on: all the axes are ordered. Principal component
consistent (15 cm) curve sampling rates. Log squaring or logs can be derived by projecting the normalised logs on
zoning (Serra and Abbott, 1980), is then applied to elim- the principal component axes (Figure J 1.24). High order
inate noise, diminish shoulder effects and in general component variations are generally unimportant and are
diminish the spread of data and harmonise sensitivities so dropped. Clustering for faciolog is now applied using this
that a log such as the MSFL is made compatible with a reduced data and produces a series of small clusters or
log such as the gamma ray (Figure 11.23). A further local modes and about 10 orginal data points have been
harmonisation is necessary to give the Jogs numerically reduced to one new one. However, the local modes are
compatible scales. Neutron log values range from 0-80 still too small to be interpretable in terms of lithology:
while the resistivity values are from 0. 1—-2000. Re-scaling there are perhaps 150 local modes but less than 20
using the standard deviation of a log’s data spread, Statistical electrofacies required.
reduces the variations to the same order. In order to decide on the level of statistical grouping,
Using the prepared database, the next stage is to apply external data may now be consulted. For statistical elec-
a statistical grouping or clustering. The Schlumberger trofacies to have a geological meaning they must be
‘Faciolog’ can be used to illustrate one approach (Wolff calibrated to a lithology or lithofacies. The type of deci-
and Pelissier-Combescure, 1982). Prior to clustering, the sions required can be nicely ijlustrated by a dendrogram
166