
Page 174 - The Geological Interpretation of Well Logs
P. 174
- THE GEOLOGICAL INTERPRETATION OF WELL LOGS -
. 0
porosity Ln
influence ___» -—,, porosity
wen onset aot
sae ee "+
Fal ee
© x amet A’,
ee ’ «
o
%
£ Gs > me
£ es ne a
i N * 4 os wt : *
organic
%y “eg
% matter
| %% = influence
Tzb. 00
-15,00 2.90 19.90 36.00 53, 00 70. 00
neutron porosity ——~_
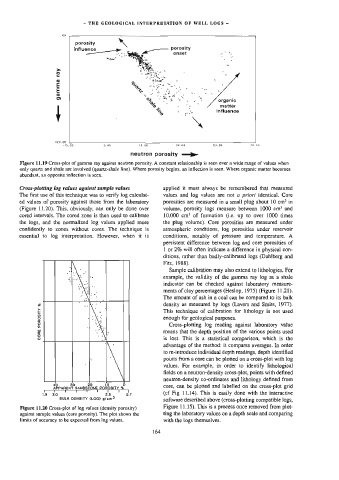
Figure 11.19 Cross-plot of gamma ray against neutron porosity. A constant relationship is seen over a wide range of values when
only quartz and shale are involved (quartz-shale line). Where porosity begins, an inflection is seen. Where organic matter becomes
abundant, an opposite inflection is seen.
Cross-plotting log values against sample values applied it must always be remembered that measured
The first use of this technique was to verify log calculat- values and log values are not @ priori identical. Core
ed values of porosity against those from the laboratory porosities are measured in a small plug about 10 cm? in
(Figure 11.20). This, obviously, can only be done over volume, porosity logs measure between 1000 cm? and
cored intervals. The cored zone is then used to calibrate 10,000 cm? of formation (i.e. up to over 1000 times
the logs, and the normalized log values applied more the plug volume). Core porosities are measured under
confidently to zones without cores. The technique is atmospheric conditions, Jog porosities under reservoir
essential to log interpretation. However, when it is conditions, notably of pressure and temperature. A
persistent difference between log and core porosities of
] or 2% will often indicate a difference in physical con-
ditions, rather than badly-calibrated logs (Dahlberg and
Fitz, 1988).
Sample calibration may also extend to lithologies. For
example, the validity of the gamma ray log as a shale
indicator can be checked against laboratory measure-
ments of clay percentages (Heslop, 1975) (Figure 11.21).
The amount of ash in a coal can be compared to its bulk
% density as measured by logs (Lavers and Smits, 1977).
POROSITY s enough for geological purposes.
This technique of calibration for lithology is not used
Cross-plotting log reading against laboratory value
CORE means that the depth position of the various points used
is lost. This is a statistical comparison, which is the
advantage of the method: it compares averages. In order
to re-introduce individual depth readings, depth identified
values. For example, in order to identify lithological
points from a core can be plotted on a cross-plot with log
fields on a neutron-density cross-plot, points with defined
neutron-density co-ordinates and lithology defined from
40 30 10 0 20
APPARENT SANDSTONE POROSITY % core, can be plotted and labelled on the cross-plot grid
[ T T T T 1 T J 1 (ef Fig 11.14). This is easily done with the interactive
19 2.0 2.5 2.7
BULK DENSITY (LOG) g/em3
software described above (cross-plotting compatible logs,
Figure 11.20 Cross-plot of log values (density porosity) Figure 11.15). This is a process once removed from plot-
against sample values (core porosity). The plot shows the ting the laboratory values on a depth scale and comparing
limits of accuracy to be expected from log values. with the logs themselves.
164