
Page 175 - The Geological Interpretation of Well Logs
P. 175
- LITHOLOGY RECONSTRUCTION FROM LOGS -
by pure, end member (hypothetical) log responses. That
is, an ‘inverse’ method in which components are defined
in advance. The methods used (i.e. Doveton, 1986; 1994)
80
effectively imitate the graphical methods discussed
previously (Figure 11.15). Pure end members (variables)
80
of matrix, fluid etc. are defined for each log: to identify x
*
.:' components (variables), n-1 logs are required, where n
>» ¢ ote
704 + is perhaps 3 or 4 and possibly up to 6, With pure end
Z Le fitee
rss ae? members such as limestone, dolomite and evaporites
x é * a ete
z 7°, +2 ¢ 4 the method can work well as responses are generally
60 *°.¥ te ;
< ¢ og haley, « linear. In the presence of shale, however, relationships
$ ee @
wa ® + are unpredictable and results are less satisfactory.
= e 6 ¢, «
3 6 ‘& t
Improvements can be made by user intervention and iter-
So ¢
> * e
ation. There is also the possibility of using several models
~ oo¢
Sol ee 38 simultaneously (Quirein et al., 1986). However, perhaps
e < ** it is best to use simple models in which user intervention
1990). The output of these methods is always in volume
130 . can be more obviously applied (Marett and Kimminau,
7
—-
20 per cent of the defined components such as clay, silt, sand
and porosity: or clay, feldspar, mica, quartz and porosity.
00 19 20 30 .40 60 -60
A tog of this type is frequently referred to as a CPI
CLAY VOLUME FAOM LOGS
(computer processed interpretation) (Figure 11.22).
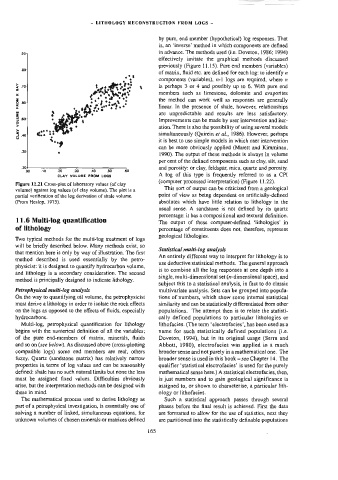
Figure 11.21 Cross-plot of laboratory values (of clay
This sort of output can be criticized from a geological
volume) against log values (of clay volume). The piot is a
partial verification of the log derivation of shale volume. point of view as being dependent on artificialiy-defined
(From Heslop, 1975). absolutes which have little relation to lithology in the
usual sense. A sandstone is not defined by its quartz
percentage: it has a compositional and textural definition.
11.6 Multi-log quantification
The output of these computer-defined ‘lithologies’ in
of lithology percentage of constituents does not, therefore, represent
geological lithologies.
Two typical methods for the multi-log treatment of logs
will be briefly described below. Many methods exist, so
Statistical muiti-log analysis
that mention here is only by way of illustration. The first
An entirely different way to interpret for lithology is to
method described is used essentially by the petro-
use deductive statistical methods. The general approach
physicist: it is designed to quantify hydrocarbon volume,
is to combine al] the log responses at one depth into a
and lithology is a secondary consideration. The second
single, multi-dimensional set (#-dimensional space), and
method is principally designed to indicate lithology.
sudject this to a statistical analysis, in fact to do classic
Petrophysical muiti-log analysis multivariate analysis. Sets can be grouped into popula-
On the way to quantifying oil volume, the petrophysicist tions of numbers, which show some internal statistical
must derive a lithology in order to isolate the rock effects similarity and can be statistically differentiated from other
on the logs as opposed to the effects of fluids, especially populations. The attempt then is to relate the statisti-
hydrocarbons. cally defined populations to particular lithologies or
Multi-log, petrophysical quantification for lithology lithofacies. (The term ‘electrofacies’, has been used asa
begins with the numerical definition of all the variables; name for such statistically defined populations (i.e.
of the pure end-members of matrix, minerals, fluids Doveton, 1994), but in its original usage (Serra and
and so on (see below). As discussed above (cross-plotting Abbott, 1980), electrofacies was applied in a much
compatible logs) some end members are real, others broader sense and not purely in a mathematical one. The
fuzzy. Quartz (sandstone matrix} has relatively narrow broader sense is used in this book see Chapter 14. The
—
properties in terms of log values and can be reasonably qualifier ‘statistical electrofacies’ is used for the purely
defined: shale has no such natural limits but none the less mathematical sense here.) A statistical electrofacies, then,
must be assigned fixed values. Difficulties obviously is just numbers and to gain geological significance is
arise, but the interpretation methods can be designed with assigned to, or shown to characterise, a particular lith-
these in mind. ology or Jithofacies.
The mathematical process used to derive lithology as Such a statistical approach passes through several
part of a petrophysical investigation, is essentially one of phases before the final result is achieved. First the data
solving a number of linked, simultaneous equations, for are formatted to altow for the use of statistics, next they
unknown volumes of chosen minerals or matrices defined are partitioned into the statistically definable populations
165