
Page 172 - The Geological Interpretation of Well Logs
P. 172
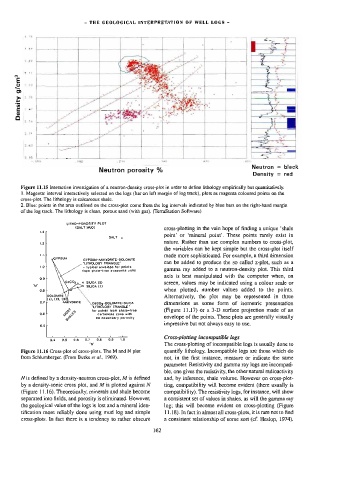
-  THE  GEOLOGICAL  INTERPRETATION  OF  WELL  LOGS  -


          "
        g/cm?


        Density                     La   en  4 eae pire  ye.   |  |  mee

                                           lig!
                                                  “|  ae  bs,  PAS
                                                   t
                                           }
                                    1   Pe  Neen  Ft   ae  mi   >  ;   ae  pte


                                                                                         Neutron     black
                                    Neutron  porosity  %
                                                                                          Density    red
        Figure  11.15  Interactive  investigation  of  a  neutron-density  ¢cross-plot  in  order  to  define  lithology  empirically  but  quantitatively.
         1.  Magenta:  interval  interactively  selected  on  the  logs  (bar  on  left  margin  of  log  track),  plots  as  magenta  coloured  points  on  the
        cross-plot.  The  lithology  is  calcareous  shale.
        2.  Blue:  points  in  the  area  outlined  on  the  cross-plot  come  from  the  {og  intervals  indicated  by  blue  bars  on  the  right-hand  margin
        of  the  log  wack.  The  lithology  is  clean,  porous  sand  (with  gas).  (TerraStation  Software)

                        LITHO-POROSITY  PLOT
                            (SALT  MUD)                    cross-plotting  in  the  vain  hope  of  finding  a  unique  ‘shale
               1.37
                                                           point’  or  ‘mineral  point’.  These  points  rarely  exist  in
                                       SALT   6
                                                           nature.  Rather  than  use  complex  numbers  to  cross-plot,
               25
                                                           the  variables  can  be  kept  simple  but  the  cross-plot  itself
               1b                                          made  more  sophisticated.  For  example,  a  third  dimension
                    GYPSUM    GYPSUM~ANHYDRITE  -DOLOMITE
                                                           can  be  added  to  produce  the  so  called  z-plot,  such  as  a
                              “LITHOLOGY  TRIANGLE’
               1.0            -  typical  envelope  for  polals
                                                           gamma  ray  added  to  a  neutron-density  plot.  This  third
                        from  shale-lrae  evaporite  zone
                                                           axis  is  best  manipulated  with  the  computer  when,  on
               90.9
             veut             ®  SILICA  (2)               screen,  values  may  be  indicated  using  a  colour  scale  or
             M                 SILICA  (1)
               0.8                                         when  plotted,  number  values  added  to  the  points.
                    OM         .                           Alternatively,  the  plot  may  be  represented  in  three
                 Kk 4),  (2),  (3   ‘
               6.               \ gacOg-DOLOMTE-SILICA     dimensions  as  some  form  of  isometric  presentation
                                 “LITHOLOGY  TRIANGLE  ”
                         os  >   for  points  Irom  shale-trae   {Figure  11.17)  or  a  3-D  surface  projection  made  of  an
                                                           impressive  but  not  always  easy  to  use.
               0.6     we  ¥       no  secondary  porcsity   envelope  of  the  points.  These  plots  are  generally  visually
                                   carbonate  zone  wilh
                        a
               0.5
                                            —
                                        ‘
                                    1
                            .
                   .
                        .

                  0.4   0.8   06   7  1   0.8   0.9   1.0   Cross-plotting  incompatible  logs
                                 a
                                                           The  cross-plotting  of  incompatible  logs  is  usually  done  to
        Figure  11.16  Cross-plot  of  cross-plots.  The  M  and  N  plot   quantify  lithology.  Incompatible  logs  are  those  which  do
        from  Schlumberger.  (From  Burke  ef  ai.,  1969).   not,  in  the  first  instance,  measure  or  indicate  the  same
                                                           parameter.  Resistivity  and  gamma  ray  Jogs  are  incompati-
                                                           ble,  one  gives  the  resistivity,  the  other  natural  radioactivity
        Nis  defined  by  a  density-neutron  cross-plot,  M  is  defined   and,  by  inference,  shale  volume.  However  on  cross-plot-
        by  a  density-sonic  cross  plot,  and  M  is  plotted  against  NV   ling,  compatibility  will  become  evident  (there  usually  is
        (Figure  11.16).  Theoretically,  minerals  and  shale  become   compatibility),  The  resistivity  logs,  for  instance,  will  show
        separated  into  fields,  and  porosity  is  eliminated.  However,   a  consistent  set  of  values  in  shales,  as  will  the  gamma  ray
        the  geological  value  of  the  logs  is  lost  and  a  mineral]  iden-   log;  this  will  become  evident  on  cross-plotting  (Figure
        tification  more  reliably  done  using  mud  log  and  simple   11.18).  In  fact  in  almost  al]  cross-plots,  it  is  rare  not  to  find
        cross-plots.  In  fact  there  is  a  tendency  to  rather  obscure   a  consistent  relationship  of  some  sort  (cf.  Heslop,  1974).
                                                       162