
Page 54 - The Geological Interpretation of Well Logs
P. 54
- THE GEOLOGICAL INTERPRETATION OF WELL LOGS -
30 000 9.033 Rock resistivity — formation resistivity factor ‘F’
Hf, as suggested above, it is only the formation waters
uf exo
that are conductive, the conductivity of the rock in
E en
3 & general should be that of the solution it contains. But it is
g 1) =
E 20 000 aos & not. Although the rock plays no active part, it plays an
£ important passive one (Figure 6.2). This passive role is
z }
> > basically dependent on rock texture or more specifically
5 =
uo > on the geometry of the pores and pore connections
3 § o
z e 2 (Figure 6.4). A good analogy is that of a comparison
8 10 000 0.50 w
Cc
between conventional roads and motorways. Vehicles
will travel far more quickly and in greater volume
s ofa waler between two towns along a wide straight motorway than
fs . along a narrow twisting conventional road. Thus, in
9 «.
° 100 000 200 G00 3090 0090 rocks, the easier the path through the pores the more cur-
CONCENTRATION NaCl ppm
rent that passes. The expression of this passive behaviour
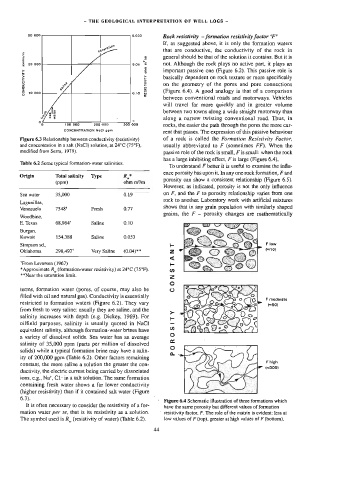
Figure 6.3 Relationship between conductivity (resistivity) of a rock is called the Formation Resistivity Factor,
and concentration in a salt (NaC]) solution, at 24°C (75°F), usually abbreviated to F (sometimes FF}, When the
modified from Serra, 1979). passive role of the rock is small, F is small: when the rock
has a large inhibiting effect, F is large (Figure 6.4).
Table 6.2 Some typical formation-water salinities.
To understand F better it is useful to examine the infiu-
ence porosity has upon it. In any one rock formation, F and
Origin Total salinity Type R,*
porosity can show a consistent relationship (Figure 6.5).
(ppm) ohm m’/m
However, as indicated, porosity is not the only influence
on F, and the F to porosity relationship varies from one
Sea water 35,000 0.19
rock to another. Laboratory work with artificial mixtures
Lagunillas,
shows that in any grain population with similarly shaped
Venezuela 7548' Fresh 0.77
grains, the F - porosity changes are mathematically
Woodbine,
E. Texas 68,964" Saline 0.10
Burgan,
Kuwait 154,388 Saline 0.053
Simpson sd., F low
5 Pr 10)
Okiahoma 298,497" Very Saline (0.04)**
{
*From Levorsen (1967) -
* Approximate A, (formation-water resistivity) at 24°C (75°F). w”
**Near the saturation limit.
z
©
terms, formation water (pores, of course, may also be ©
filled with oil and natural gas), Conductivity is essentially
F moderate
restricted to formation waters (Figure 6.2). They vary en )
from fresh to very saline: usually they are saline, and the
>
salinity increases with depth (e.g. Dickey, 1969). For =
oilfield purposes, salinity is usually quoted in NaC
wy
equivalent salinity, although formation-water brines have
oO
a variety of dissolved solids. Sea water has an average
fad
salinity of 35,000 ppm (parts per million of dissolved
oO
solids) while a typical formation brine may have a salin-
a
ity of 200,000 ppm (Table 6.2). Other factors remaining
constant, the more saline a solution the greater the con- F high
ductivity, the electric current being carried by dissociated rr (=300}
ions, e.g., Na*, C1- in a salt solution. The same formation
containing fresh water shows a far lower conductivity
higher resistivity) than if it contained salt water (Figure
6.3).
Figure 6.4 Schematic illustration of three formations which
It is often necessary to consider the resistivity of a for- have the same porosity but different values of formation
mation water per se, that is its resistivity as a solution. ” resistivity factor, F. The role of the matrix is evident: less at
The symbol used is R,, (resistivity of water) (Table 6.2). low values of F (top), greater at high values of F (bottom).