Page 59 - The Geological Interpretation of Well Logs
P. 59

-  RESISTIVITY  AND  CONDUCTIVITY  LOGS  -

         Table  6.5  Variations  in  filtrate  and  formation-water  resistivity   replace  the  oil  and  gas  immediately  around  the  borehole,
          values,  as  read  by  resistivity  tools  (see  aiso  Figure  6.9).   essentially  replacing  them  through  the  flushed  zone,
                                                            while  the  original  saturation  in  hydrocarbons  is  only

                       Formation-water  salinity
                                                            found  in  the  virgin  formation  (Figure  6.11,/).  A  resistivity

                                                            profile  across  a  hydrocarbon  zone  will  show  a  flushed
                       Fresh    Formation-    Saline
                                                            zone  with  a  moderate  to  low  resistivity,  filled  with  mud
                       formation   water  salinity=   formation
                                                            filtrate  (with  resistivity  depending  on  mud  type)  and  the
                       water    filtrate  salinity   water
                                                            virgin  formation  with  an  extremely  high  resistivity
         Saltwater  mud
                                                            because  of  the  high  saturation  in  hydrocarbons.  Both  oil
          (usual  offshore)  R,,<R,   R=R,    Ri   R,
                                                            and  gas  are  infinitely  resistive  and  show  the  same  effect
         Freshwatermud   &  2  R,   RR,       RR,
                                                            on  resistivity  logs.  The  resistivity  profile  then,  shows  a  big
         Oil-based  mud  _—  Oil  filtrate  contamination   inctease  away  from  the  borehole,  the  exact  reverse  of  a
          (special  cases)   Only  R,  induction  is  usable   water  zone.  (Figure  6.11,/).  This  increase  in  resistivity
                                                            deeper  into  the  formation,  away  from  the  borehole,  is
             100%
                                                            expressed  very  distinctly  on  the  logs.  Shallow  looking
                                        residual  oil
                                                            tools  which  read  in  the  flushed  zone  show  low  (relatively)
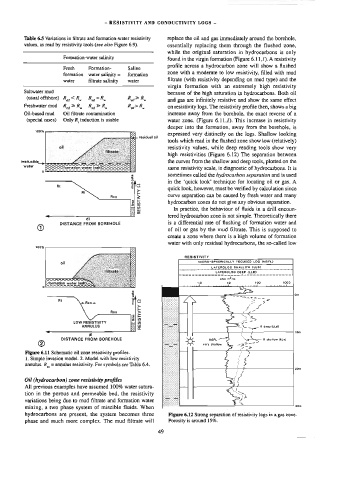
                                                            resistivity  values,  while  deep  reading  tools  show  very
                                                            high  resistivities  (Figure  6.12)  The  separation  between
        iveducible_,                                        the  curves  from  the  shallow  and  deep  tools,  plotted  on  the
                                                            same  resistivity  scale,  is  diagnostic  of  hydrocarbons.  It  is
         water
                9°                                          sometimes  called  the  Aydrocarbon  separation  and  is  used
                                                 >  caka    in  the  ‘quick  look’  technique  for  locating  oil  or  gas.  A
                                                mud         quick  look,  however,  must  be  verified  by  calculation  since
                                         a   %   2          curve  separation  can  be  caused  by  fresh  water  and  many
                                                Rme   RESISTIVTY   hydrocarbon  zones  do  not  give  any  obvious  separation.
                                                NY            In  practice,  the  behaviour  of  fluids  in  a  drill  encoun-

                                                            tered  hydrocarbon  zone  is  not  simple.  Theoretically  there
                               di
                                                            is  a  differential  rate  of  flushing  of  formation  water  and
                      DISTANCE  FROM  BOREHOLE
                                                            of  oil  or  gas  by  the  mud  filtrate.  This  is  supposed  to
                                                            create  a  zone  where  there  is  a  high  volume  of  formation
                                                            water  with  only  residual  hydrocarbons,  the  so-called  low
              100%
                                                                  RESISTIVITY

                                                                       MICRO-SPHERICALLY  FOCUSED  LOG  (MSFL)

                                                                           LATEROLOG  SHALLOW  ILLS)

                                                                             LATEROLOG  OEEP  {LLO)
                     RS
                9  ESS                        x

                                                mud cake
                      Rt                          QQ
                             ae  Ran
                                        Rxo       RESISTIVTY

                                                   WET
                           LOW  RESISTIVITY
                              ANNULUS                                                  oye   R  deep  (LLd)

                                dl
                       DISTANCE  FROM  BOREHOLE                                       wae  &  shallow  (LL)
              @

          Figure  6.11  Schematic  oil  zone  resistivity  profiles.
          1.  Simple  invasion  model.  2.  Model  with  low  resistivity
          annulus.  R,,  =  anoulus  resistivity.  For  symbols  see  Table  6.4.
                                                                         20m
          Oil  (hydrocarbon)  zone  resistivity profiles
          mixing,  a  two  phase  system  of  miscible  fluids.  When
          All  previous  examples  have  assumed  100%  water  satura-
          tion  in  the  porous  and  permeable  bed,  the  resistivity
          variations  being  due  to  mud  filtrate  and  formation  water
                                                                   30m
          hydrocarbons  are  present,  the  system  becomes  three   Figure  6.12  Strong  separation  of  resistivity  logs  in  a  gas  zone.
          phase  and  much  more  complex.  The  mud  filtrate  will   Porosity  is  around  15%.
                                                        49
   54   55   56   57   58   59   60   61   62   63   64