
Page 63 - The Geological Interpretation of Well Logs
P. 63
- RESISTIVITY AND CONDUCTIVITY LOGS ~
AIS ohm-m
200
1040m
1050m
7 \ \
rn
1 41
haf
vf
/
KS 7 f
WN
movement i \\ ~~ ~
tool
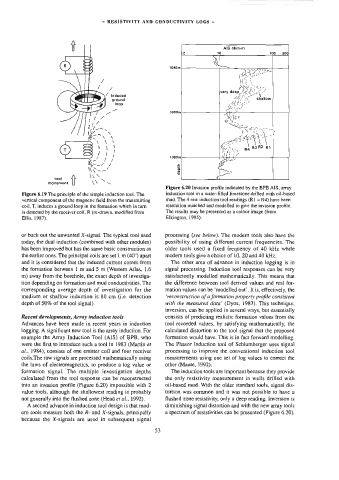
Figure 6.20 Invasion profile indicated by the BPB AIS, array
Figure 6.19 The principle of the simple induction tool. The induction tool in a water-filled limestone drilled with oil-based
vertical component of the magnetic field from the transmitting mud. The 4 raw induction tool readings (R1 — R4) have been
coil, T, induces a ground loop in the formation which in turn resolution matched and modelled to give the invasion profile.
is detected by the receiver coil, R {re-drawn, modified from The results may be presented as a colour image (from
Ellis, 1987). Elkington, 1995).
or buck out the unwanted X-signal. The typical tool used processing (see below). The modern tools also have the
today, the dual induction (combined with other modules) possibility of using different current frequencies. The
has been improved but has the same basic construction as older tools used a fixed frequency of 40 kHz while
the earlier ones. The principal coils are set | m (40") apart modem tools give a choice of 10, 20 and 40 kHz.
and it is considered that the induced current comes from The other area of advance in induction logging is in
the formation between ] m and 5 m (Western Atlas, 1.6 signal processing. Induction tool responses can be very
m) away from the borehole, the exact depth of investiga- satisfactorily modelled mathematically. This means that
tion depending on formation and mud conductivities, The the difference between tool derived values and real for-
cormesponding average depth of investigation for the mation values can be ‘modelled out’. It is, effectively, the
medium or shallow induction is 80 cm (i.e. detection ‘reconstruction of a formation property profile consistent
depth of 50% of the tool signal). with the measured data’ (Dyos, 1987). This technique,
inversion, can be applied in several ways, but essentially
Recent developments, Array induction tools consists of predicting realistic formation values from the
Advances have been made in recent years in induction tool recorded values, by satisfying mathematically, the
logging. A significant new tool is the array induction. For calculated distortion to the tool signal that the proposed
example the Array Induction Tool (AIS) of BPB, who formation would have. This is in fact forward modelling.
were the first to introduce such a tool in 1983 (Martin er The Phasor Induction tool of Schlumberger uses signal
al., 1984), consists of one emitter coil and four receiver processing to improve the conventional induction tool
coils. The raw signals are processed mathematically using measurements using one set of log values to correct the
the laws of electromagnetics, to produce a log value or other (Maute, 1992),
formation signal. The multiple investigation depths The induction tools are important because they provide
calculated from the tool response can be reconstructed the only resistivity measurement in wells drilled with
into an invasion profile (Figure 6.20) impossible with 2 oil-based mud. With the older standard tools, signal dis-
value tools, although the shallowest reading is probably tortion was common and it was not possible to have a
not generally into the flushed zone (Head ef ai., 1992). flushed zone resistivity, only a deep reading. Inversion is
A second advance in induction tool design is that mod- diminishing signal distortion and with the new array tools
em tools measure both the R- and X-signals, principally a specuum of resistivities can be presented (Figure 6.20).
because the X-signals are used in subsequent signal 53