
Page 58 - The Geological Interpretation of Well Logs
P. 58
- THE GEOLOGICAL INTERPRETATION OF WELL LOGS -
) Invasion Profile - Well A (2) Invasion Profile - Well A
WIRELINE -. LWD WIRELINE = |. Wireline Log vs. LWD
SP ° & RESISTIVITY SP we RESISTIVITY
0 \ 100 0.0 61.0 20 3.0 4.0 5.0 0 ' 109 0.0 1.0 20 3.0 4.0 5.0
T 7 T T T v tT
e950 6960,
5970 6970+
~.
Mo, ~s
“S> ws,
i i See a i. ”
6980 Bs 6980 i"
wi od
ee
7 6990;- 6990+
Time
Progression
4 7000 4 L
00 WHILE ORILLING 7000 LWD: WHILE
- 34 be DRILLING
: LW: RELOG AFTER
7.9 brs 300 hrs
. DEEP LOG INDUCTION
47010 t? S ~ 38.8 his 47010- ta
104.5 brs
.
(408 hrs?
* $356.5 drs SFL LOG [408 tvs)
1
oe
300.0 ts
1G
LY
A
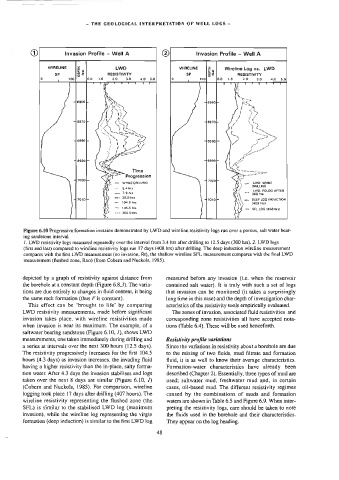
Figure 6.10 Progressive formation invasion demonstrated by LWD and wireline resistivity logs run over a porous, salt water bear-
ing sandstone interval.
1. LWD resistivity logs measured repeatedly over the interval from 3.4 hrs after drilling to 12.5 days (300 hrs). 2. LWD logs
(first and last) compared to wireline resistivity logs run 17 days (408 brs) after drilling. The deep induction wireline measurement
compares with the first LWD measurement {no invasion, Rt), the shallow wireline SFL measurement compares with the fina] LWD
measurement (fiushed zone, Rxo) (from Cobern and Nuckols, 1985).
depicted by a graph of resistivity against distance from measured before any invasion (i.e. when the reservoir
the borehole at a constant depth (Figure 6.8,3). The varia- contained salt water). It is truly with such a set of logs
tions are due entirely to changes in fluid content, it being that invasion can be monitored (it takes a surprisingly
the same rock formation (thus F is constant). long time in this case) and the depth of investigation char-
This effect can be ‘brought to life’ by comparing acteristics of the resistivity tools empirically evaJuated.
LWD resistivity measurements, made before significant The zones of invasion, associated fluid resistivities and
invasion takes place, with wireline resistivities made corresponding zone resistivities all have accepted nota-
when invasion is near its maximum. The example, of a tions (Table 6.4). These will be used henceforth.
saltwater bearing sandstone (Figure 6.10, /), shows LWD
measurements, one taken immediately during drilling and Resistivity profile variations
a series at intervals over the next 300 hours (12.5 days). Since the variations in resistivity about a borehole are due
The resistivity progressively increases for the first 104.5 to the mixing of two fluids, mud filtrate and formation
hours (4.3 days) as invasion increases, the invading fluid fluid, it is as wel] to know their average characteristics.
having a higher resistivity than the in-place, salty forma- Formation-water characteristics have already been
tion water. After 4.3 days the invasion stabilises and logs described (Chapter 2). Essentially, three types of mud are
taken over the next 8 days are similar (Figure 6.10, /) used; saltwater mud, freshwater mud and, in certain
(Cobern and Nuckols, 1985). For comparison, wireline cases, oil-based mud. The different resistivity regimes
logging took place 17 days after drilling (407 hours), The caused by the combinations of muds and formation
wireline resistivity representing the flushed zone (the waters are shown in Table 6.5 and Figure 6.9. When inter-
SFL) is similar to the stabilised LWD log (maximum preting the resistivity logs, care should be taken to note
invasion), while the wireline log representing the virgin the fluids used in the borehole and their characteristics.
formation (deep induction) is similar to the first LWD log They appear on the log heading.
48