
Page 57 - The Geological Interpretation of Well Logs
P. 57
- RESISTIVITY AND CONDUCTIVITY LOGS -
Table 6.4 Resistivily notation.
Fluid resistivity
Formation resistivity (laboratory measured and/ Fluid saturation
Zone (tool measured) or log calculated)
Hole R,, (m = mua) R,
Mud cake R, (me = mud cake) Rac
Flushed zone R. R_, (mf mud filtrate) S,, (saturation in mud filtrate)
=
Invaded zone
(transition) R, (i = invaded) R,(R,, +R, mixed)
Uninvaded zone *R (t= true) R, (w = formation water) S,, (saturation in
R, (0 = original) formation water
*R_ = true, uninvaded formation resistivity of rock which may contain hydrocarbons — too! measured.
R, = Original, uninvaded formation resistivity of rock with 100% formation water saturation. Cannot be too] measured.
It is an ideal figure for calculations. In clean /00% water-saturated zones R, = R, {or is very close).
5 LOG RESPONSES RESISTIVITY PROFILES
= o
3 € ¢ R_desp (R,)
6 ¢ -=~ ate UMINYACED (INVACED FLUSHED
2 8 R_shallow (Ryo) one TOME |ZONE|MYO CAKE
5 2 zg vy om obm mé4m {
£ ° 2 e
$
7
2 2
>
~ Rat &R es co
.
«t) “ Ee «
Ros Ry =3
£ a R
10m ° : x0
ZONES OF INVASION = ———_§|# Di —
om onm mesm F
7
(2) 100% 3
:
, 1 FLUID MIXING RU=R os]
_ mi w —e
formation mud R R us oO
water (R,,) filtrate fluld resistivities xo tl ( 25 S
(Rp 10m a?) 5 R t R xO > 5
mi Ry Rent
1 2 =
° ov
Rio ° A
om é
i & RESISTIVITY PROFILE = 5
‘ 5 -
R ‘ g |r (schematic) Rent > Pw \ es a
R ' be | 2 salt formation water f =$\p
t ‘ Elan RL OR 7 = t R.
; ‘ Xiu Tool measured resistivities XO t , a xo
—______ Rae Bi Pgs Bing 10m o
distance trom borehole om 2am orm $
. « 1 =
Ze
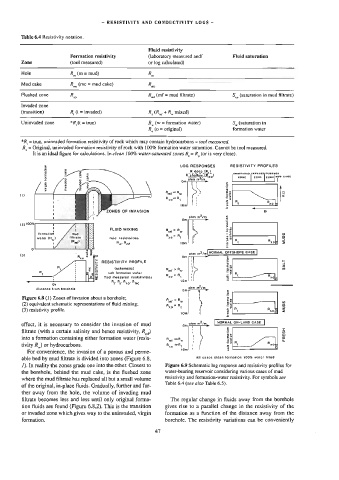
Figure 6.8 (1) Zones of invasion about a borehole; RFR
. : . ty ee =)
(2) equivalent schematic representations of fluid mixing; a, = . S53 g
ee 8 a
(3) resistivity profile, | aR, eof 3
10m ! 2
es . : : 2 ~
effect, it is necessary to consider the invasion of mud ne Trev
: . soe sess A 7
filtrate (with a certain salinity and hence resistivity, R,,.) 2 é
+ + soe . . - 5 w
into a formation containing either formation water (resis- Ray eR, | | He ©
os t 23 8
tivity R,) or hydrocarbons. RoR, | = Lt Rxo
10m! 1 a
For convenience, the invasion of a porous and perme-
All cases clean formation 100% walter filled
able bed by mud filtrate is divided into zones (Figure 6.8,
/). In reality the zones grade one into the other. Closest to Figure 6.9 Schematic log response and resistivity profiles for
the borehole, behind the mud cake, is the flushed zone water-bearing reservoir considering various cases of mud
resistivity and formation-water resistivity. For symbols see
where the mud filtrate has replaced all but a small volume
Table 6.4 (see aiso Table 6.5).
of the original, in-place fluids. Gradually, further and fur-
ther away from the hole, the volume of invading mud
filtrate becomes less and less until only original forma- The regular change in fluids away from the borehole
tion fluids are found (Figure 6.8.2). This is the transition gives rise to a parallel change in the resistivity of the
or invaded zone which gives way to the uninvaded, virgin formation as a function of the distance away from the
formation. borehote. The resistivity variations can be conveniently
47