
Page 66 - The Geological Interpretation of Well Logs
P. 66
- THE GEOLOGICAL INTERPRETATION OF WELL LOGS -
characteristics in which individual beds are unimportant. the resistivity logs. However, the original conductivity
Such is the case with shale porosity trends and cortela- values, in millimhos/m, can also be plotted. The scale is
tion. The deep-reading logs should not be used for generally 0-2000 mmho. The micro-inverse and micro-
absolute bed values or characteristics which have rapid normal combination of resistivities is generally plotted
vertical changes (vertical anisotropy). Texture-related on track 1. The scales are identical for the two logs,
changes are best seen on the logs from tools mainly influ- generally 0-10 ohm m*/m.
enced by the invaded zone. There is a mixing of The presentation format of the new multi-value resis-
formation water and mud filtrate in the invaded zone and tivity and conductivity tools is variable (Figure 6.20). As
the way in which it takes place is very dependent on for- a final processing these logs can lead to the production of
mation texture. Such changes cannot, in general, be seen an invasion profile, generally presented as a colour scale
on the logs from deep-reading devices. Rapid vertical plot of water saturation or invasion. The most effective
anisotropy is best seen on the micro-logs. The identifica- method of presentation, in which the raw data can be
tion of thin source beds, for example, is possible only assessed, is to plot the actua) values in resistivity scale
with the jogs from the micro-tools. This sort of rapid alongside the colour scale invasion profile. However,
variation is generally associated with the structure of a there is a tendency on the side of the service companies
formation, simply to present a colour plot, which inevitably looks
The use of the resistivity logs for geological interpreta- impressive but cannot be judged for validity.
tion should thus make use of the general indications
Unwanted logging effects
as follows: gross characteristics — deep logs; texture -
The resistivity and conductivity logs are especially
intermediate logs; texture and structure — micro-logs.
affected by large resistivity contrasts between the logging
Log format and scales environment and the formation. Table 6.8 gives a résumé
The unit of resistivity logs is ohms m?/m; it is called the of these effects and their importance.
ohm metre for short.
Resistivity logs are plotted on a logarithmic scale, either
6.7 Quantitative uses of the
in track 2 alone, or in tracks 2 and 3 (Figure 6.22). The
values are usually 0.20-20.0 ohm m?/m for one track, or resistivity logs
0.20-2000 ohm m*/m when tracks 2 and 3 are used
The quantitative use of log resistivity measurements is at
together.
the heart of the whole domain of quantitative well-log
Deep and shallow tool readings are plotted side by side
interpretation — the domain of petrophysics. Rock resis-
on the same track to allow direct comparison. The actual
livity was the parameter depicted on the first well log and
logs plotted depends on the logging tool combination.
it was also the first parameter to be used quantitatively.
The example (Figure 6.22) shows a dual laterolog from
The principal use of well logs is to detect oil: the princi-
Schlumberger with the logs plotted from the deep and
pal use of the resistivity log is to quantify oil (and of
shallow laterologs and the micro-spherically focused
course, gas). That is, resistivity logs are used to give the
device, and also an ISF log with curves from the deep
volume of oil in a particular reservoir, or, in petrophysical
induction too! (converted to resistivity) and the spheri-
terms, to define the water saturation, S,. When S, is not
cally-focused device.
100% there are hydrocarbons present:
The induction log, as the above example shows (Figure
6.22), can be plotted directly in resistivity units alongside 1-S,=5S,_(S,, = saturation in hydrocarbons).
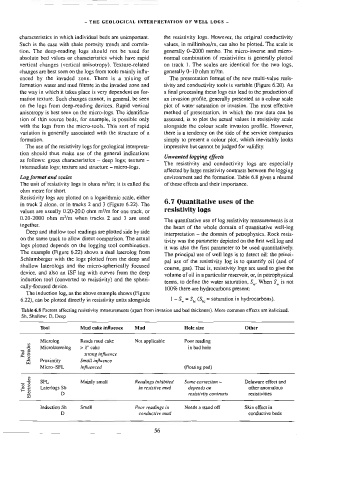
Table 6.8 Factors affecting resistivity measurements (apart from invasion and bed thickness). More common effects are italicized.
Sh, Shallow, D, Deep
Tool Mud cake influence Mud Hole size Other
oe Microlog Reads mud cake Not applicable Poor reading
~ 3 Microlaterolog > 4" cake in bad hole
& 3 Strong influence
ma Proximity Smail influence
Micro—SFL influenced (floating pad)
_% SFL Mainly small Readings inhibited Some correction -— Delaware effect and
3
é 5 Laterlogs Sh In resistive mud depends on other anomalous
3 D resistivity contrasts resistivities
Induction Sh Smail Poor readings in Needs a stand off Skin effect in
D conductive mud conductive beds
56