
Page 71 - The Geological Interpretation of Well Logs
P. 71
- RESISTIVITY AND CONDUCTIVITY LOGS -
RESISTIVITY
Scate: ohms m2 ¢m(2}
1 10 100 1000 10 900
SHALE
Q SHALE
SANDY
very variable
SHALE-SILT
GALCAREOUS
SHALE
TIGHT
LIMESTONE 2 80-6000
POROUS
LIMESTONE
(SALT WATER)
COAL
2190 000 - »
ANHYORITE 210 000 - »
GYPSUM NAAAAAAAA 21000
AA AAR ARAL
AAAAAAAA
AAA
SHALE
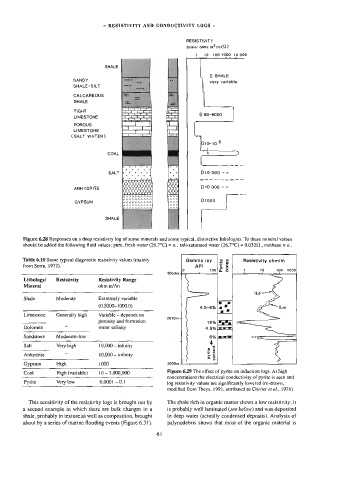
Figure 6.28 Responses on a deep resistivity log of some minerals and same typical, distinctive lithologies. To these mineral values
should be added the following fluid values: pure, fresh water (26.7°C) = a , salt-saturated water (26.7°C) = 0.03222 , methane = « .
Table 6.10 Some typical diagnostic resistivity values (mainiy Gamma ray Resistivity ohm/m
from Serra, 1972). API Pyrite zones
° 100 1 19 100 1000
1
2050m
J.
Lithology/ —_ Resistivity Resistivity Range
Mineral ohm m?/m
Shale Moderate Extremely variable
(0.5000-1000.0) 4.5-6%
Limestone Generally high Variable ~ depends on
2070m
—___ porosity and formation 16%
Dolomite « water salinity > oO x
Sandstone Moderate-low ~ >t
Salt Very high 10,000 — infinity
pyrite content
‘Anhydrite “ 10,000 infinity
~
Gypsom High —SCSC«*L000 2080m
Figure 6.29 The effect of pyrite on induction logs. At high
-
Coal High (variable) 10 1,000,000
concentrations the electrical conductivity of pyrite is seen and
Pyrite Very low 0.0001 - 0.1 log resistivity values are significantly lowered (re-drawn,
modified from Theys, 1991, attributed to Clavier et al... 1976).
This sensitivity of the resistivity logs is brought out by The shale rich in organic matter shows a low resistivity; it
a second example in which there are bulk changes in a is probably well laminated (see below) and was deposited
shale, probably in texture as well as composition, brought in deep water (actually condensed deposits). Analysis of
about by a series of marine flooding events (Figure 6.31). palynodebris shows that most of the organic material is
6l