
Page 74 - The Geological Interpretation of Well Logs
P. 74
- THE GEOLOGICAL INTERPRETATION OF WELL LOGS -
>
o
9 ------- {NOUCTION 6FF4
Oo 16" NORMAL
iz 2
EF 1.0 10 ohm m“ém 109
oO — pd til po tt il
CYCLE 4
25
coal —> ~ 3
GYCLE
sitt —e
CYCLE 2
(m)
depth
CYCLE 1
~ a —t te 15 miles
10
6
Oo
=
E> 20 ohm m
<15 ohm m
5-20 ohm m
ZZA reel
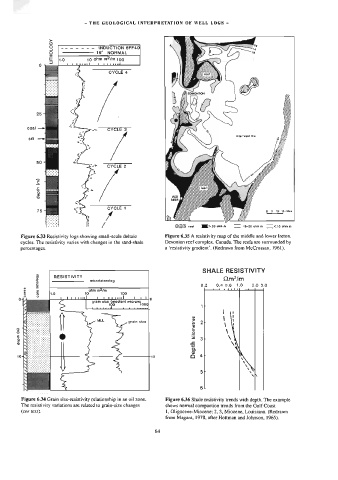
Figure 6.33 Resistivity logs showing small-scale deltaic Figure 6.35 A resistivity map of the middle and lower Ireton.
cycles. The resistivity varies with changes in the sand-shale Devonian reef complex, Canada. The reefs are surrounded by
percentages. a ‘resistivity gradient’. (Redrawn from McCrossan, 1961).
SHALE RESISTIVITY
3 RESISTIVITY
Qm?2/m
3 —)—rmicrolaterolaog
£ 0.2 0.40.6 1.0 2.0 3.0
4a be ty L
s ° ohm m2/m
3 3 4.0 10 400
o4- Me pot ty to a til Litly
] grain size fmedian) microns
100. 4009)
MLL in si
a“ aw grain size
z 4 kilometres
x=
a
oD
vo Depth
10- 10
6L
Figure 6.34 Grain size-resistivity relationship in an oil zone. Figure 6.36 Shale resistivity wends with depth. The example
The resistivity variations are related to grain-size changes shows normal compaction trends from the Gulf Coast
(see text). 1, Oligocene-Miocene; 2, 3, Miocene, Louisiana. (Redrawn
from Magara, 1978, after Hottman and Johnson, 1965).