Page 75 - The Geological Interpretation of Well Logs
P. 75

-  RESISTIVITY  AND  CONDUCTIVITY  LOGS  -


                   lo  4000   4000   CONDUCTIVITY           trend  below.  The  abrupt  increase  is  probably  related  to
                          0   4000  =  mmbho/m              and  caused  by  an  increase  in  shale  porosity  which  occurs
                 oO   t   1   1   1

                                                            as  the  overpressured  zone  is  entered  (Schmidt,  1973).
                                                            Plotting  shale  conductivity  with  depth  therefore  brings
                                                            out  normal]  pressure  and  compaction  trends,  and  abnor-
                  4
                  4             shale  &                    mally  pressured  zones.  Care  must  be  taken  with  such
                                      ~~   fe
                                                            plots  to  ensure  that  the  changes  are  not  due  to  variations
                  :                     e                   in  shale  composition  (cf.  Figure  6.31}.  [f  enough  data  are
                                       ‘S
              §000  4                  s                    available  in  a  particular  region,  tables  can  be  constructed
                                                            to  give  quantitative  estimates  of  over-pressure  from
             =      shale  conductivity   /                 resistivity  values  (Ichara  and  Avbovbo,  1985).  This
             Ee   4    4                                    relationship  has  taken  on  considerable  importance  with
              s       yf          fe
              s   |              /"s                        the  advent  of  LWD  measurements  since  resistivity
              3       3          ‘
                                                            (conductivity)  anomalies  can  now  be  detected  during
                      :        ,*
             19  000+  }      na          top  of           drilling  (Rasmus  and  Voisin,  1990).
                                      ——--—__—_—
                                                              Normal  conductivity  depth  trends  may  be  used  simply
                  |   /  Tt  wa.   /   xv  x,   overpressure   to  indicate  geological  compaction.  In  rapidly-deposited
                  4      wy,  £   /                         or  stratigraphically  contiguous  zones,  compaction  will  be
                                                            persistent  and  regular.  When  there  is  a  break,  either  in
                       ‘.
                  4   /   See                               sedimentation  or,  more  importantly,  an  unconformity,
                                          a
                                       a
                               TT
             15  000                                        compaction  trends  wil]  be  interrupted  and  hence  so  will
                            10   44      20     26          resistivity  trends.  Breaks  in  resistivity  trends  can  there-
                               SHALE  POROSITY  %           fore  be  used  to  diagnose  geological  breaks  (see  Chapters

                                                            14,  15).
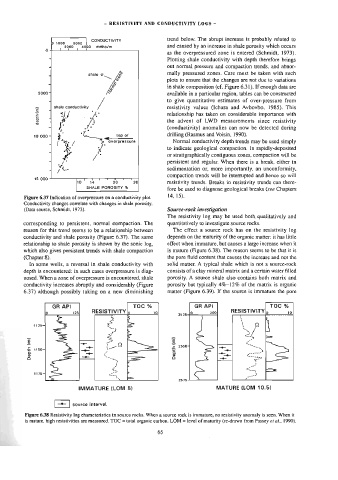
         Figure  6.37  Indication  of  overpressure  on  a  conductivity  plot.
         Conductivity  changes  correlate  with  changes  in  shale  porosity.
          (Data  source,  Schmidt,  1973).                  Source-rock  investigation
                                                            The  resistivity  log  may  be  used  both  qualitatively  and
         corresponding  to  persistent,  normal  compaction.  The   quantitatively  to  investigate  source  rocks.
         reason  for  this  trend  seems  to  be  a  relationship  between   The  effect  a  source  rock  has  on  the  resistivity  log
         conductivity  and  shale  porosity  (Figure  6.37).  The  same   depends  on  the  maturity  of  the  organic  matter:  it  has  little
         relationship  to  shale  porosity  is  shown  by  the  sonic  log,   effect  when  immature,  but  causes  a  large  increase  when  it
         which  also  gives  persistent  trends  with  shale  compaction   is  mature  (Figure  6.38),  The  reason  seems  to  be  that  it  is
         (Chapter  8).                                      the  pore  fluid  content  that  causes  the  increase  and  not  the
           In  some  wells,  a  reversal  in  shale  conductivity  with   solid  matter.  A  typical  shale  which  is  not  a  source-rock
         depth  is  encountered:  in  such  cases  overpressure  is  diag-   consists  of  a  clay  mineral  matrix  and  a  certain  water  filled
         nosed.  When  a  zone  of  overpressure  is  encountered,  shale   porosity.  A  source  shale  also  contains  both  matrix  and
         conductivity  increases  abruptly  and  considerably  (Figure   porosity  but  typically  4%—12%  of  the  matrix  is  organic
         6.37)  although  possibly  taking  on  a  new  diminishing   matter  (Figure  6.39).  If  the  source  is  immature  the  pore

                   GR  API                      TOC  %               GR  API                    TOC  %
                 9         125   RESISTIVITY  |,       10       2525-42    200    RESISTIVITY],       iS

                                        3
             112644                    a                                              \    9  \
                                         “5   q                                       MS
           =                           S      5”             €                         mt     —

           =                  ~~      ot   Q                                            Se
                                                                              =
                                                                 2680-
           S  11680-           —_     Ya                                        -           ss
                                                             a
           o                   —-—    x                                       Sef)      SD
                                                              5
                                                                              >
                                                             a                            =
           6                  =        i
                                         <                                              “
                                              r
                                                                                              —-
             1175                                               2675
                                       we  OP
                                                                                       pa


                             IMMATURE  (LOM  5)                              MATURE  {LOM  10.5)
                           source  interval
          Figure  6.38  Resistivity  log  characteristics  in  source  rocks.  When  a  source  rock  is  immature,  no  resistivily  anomaly  is  seen.  When  it
          is  mature,  high  resistivities  are  measured.  TOC  =  total  organic  carbon.  LOM  =  level  of  maturity  (re-drawn  from  Passey  ef  al.,  1990).
                                                        65
   70   71   72   73   74   75   76   77   78   79   80