
Page 79 - The Geological Interpretation of Well Logs
P. 79
- THE GAMMA RAY AND SPECTRAL GAMMA RAY LOGS -
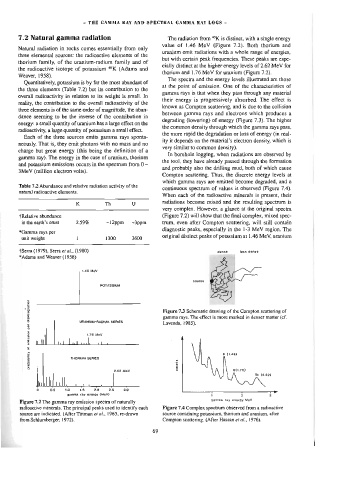
7.2 Natural gamma radiation The radiation from *°K is distinct, with a single energy
value of 1.46 MeV (Figure 7.2). Both thorium and
Natural radiation in rocks comes essentially from only
uranium emit radiations with a whole range of energies,
three elemental sources: the radioactive elements of the
but with certain peak frequencies. These peaks are espe-
thorium family, of the uranium-radium family and of
cially distinct at the higher energy levels of 2.62 MeV for
the radioactive isotope of potassium “K (Adams and
thorium and 1.76 MeV for uranium (Figure 7.2).
Weaver, 1958).
The spectra and the energy levels illustrated are those
Quantitatively, potassium is by far the most abundant of
at the point of emission. One of the characteristics of
the three elements (Table 7.2) but its contribution to the
gamma rays is that when they pass through any material
overall radioactivity in relation to its weight is small. In
their energy is progressively absorbed. The effect is
reality, the contribution to the overall radioactivity of the
known as Compton scattering, and is due to the collision
three elements is of the same order of magnitude, the abun-
between gamma rays and electrons which produces a
dance seeming to be the inverse of the contribution in
degrading (lowering) of enecgy (Figure 7.3). The higher
energy: a small quantity of uranium has a large effect on the
the common density through which the gamma rays pass,
radioactivity, a large quantity of potassium a small effect
the more rapid the degradation or loss of energy (in real-
Each of the three sources emits gamma rays sponta-
ity it depends on the material’s electron density, which is
neously. That is, they emit photons with no mass and no
very similar to common density).
charge but great energy (this being the definition of a
In borehole logging, when radiations are observed by
gamma ray). The energy in the case of uranium, thorium
the tool, they have already passed through the formation
and potassium emissions occurs in the spectrum from 0 -
and probably also the drilling mud, both of which cause
3MeV (million electron volts).
Compton scattering. Thus, the discrete energy levels at
which gamma rays are emitted become degraded, and a
Table 7,2 Abundance and relative radiation activity of the
continuous spectrum of values is observed (Figure 7.4).
natura] radioactive elements.
When each of the radioactive minerals is present, their
radiations become mixed and the resulting spectrum is
K Th Uv
very complex. However, a glance at the original spectra
fRelative abundance (Figure 7.2) will show that the final complex, mixed spec-
in the earth’s crust 2.59% ~l2ppm ~3ppm trum, even after Compton scattering, will still contain
diagnostic peaks, especially in the 1-3 MeV region. The
*Gamuma rays per
original distinct peaks of potassium at 1.46 MeV, uranium
unit weight i 1300 3600
+Serra (1979), Serra er al., (L980) dense loss dense
*Adams and Weaver (1958)
1.46 Mev
source
POTASSIUM
disiniagration Figure 7.3 Schematic drawing of the Compton scattering of
URANIUM-RADIUM SERIES gamma rays. The effect is more marked in denser matter (cf.
Lavenda, 1985).
per
emission l! ! ' 4.76 MeV
of Loral rt 4
probability THORIUM SERIES counts
K (1,46)
2.62 MeV u(1.76>
Th (2.62)
us |
1 5 2.5 3.0
>
*
gamma ray ensroy eev) ’ 2 3
gamma ray energy MeV
Figure 7.2 The gamma ray emission spectra of naturally
radioactive minerals. The principal peaks used to identify each Figure 7.4 Complex spectrum observed from a radioactive
source are indicated. (After Titman et ai., 1965, re-drawn source containing potassium, thorium and uranium, after
from Schlumberger, 1972). Compton scattering. (After Hassan et a/., 1976).
69