
Page 81 - The Geological Interpretation of Well Logs
P. 81
- THE GAMMA RAY AND SPECTRAL GAMMA RAY LOGS -
The relative contributions of the three radioisotopes are 0-100 or 0-150 API are common (Figure 7.6a). The tool
therefore measured by the tool. These can be related to is small and can be combined with practically any other
the abundance of each element by comparison with tool be it a resistivity or porosity device.
known spectra, since the measured, composite spectrum,
Spectral gamma ray log — The essential results of the
is a simple addition of the spectra from the three different
spectral gamma ray tool are elementa)] abundances,
sources. Using the known abundances of the radioiso-
derived as described above. The calibration facility for
topes in normal elemental mixtures (Table 7.4), the actual
the spectral tools is the same pit in the University of
abundances of each element can be derived. Thus, the
Houston that is used for the simple gamma ray tool. This
log results from the spectral too] are the quantitative,
is because the high activity cement of this pit has known
elemental abundances of thorium, uranium and potassium
quantities of uranium (13.1 ppm), thorium (24.4 ppm)
(Section 7,4, Figure 7.6).
and potassium (4.07%) which contribute to the overall
radioactivity (Belknap et a/., 1959). The individual chan-
7.4 Log characteristics
nels of the spectra] too] can be empirically calibrated.
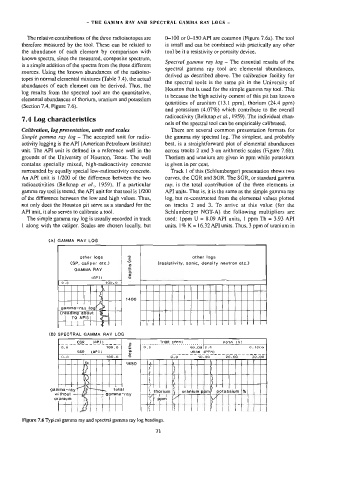
Calibration, log presentation, units and scales There are several common presentation formats for
Simple gamma ray log — The accepted unit for radio- the gamma ray spectral log. The simplest, and probably
activity logging is the API (American Petroleum Institute) best, is a straightforward plot of elemental abundances
unit. The API unit is defined in a reference well in the across tracks 2 and 3 on arithmetic scales (Figure 7.6b).
grounds of the University of Houston, Texas. The well Thorium and uranium are given in ppm while potassium
contains specially mixed, high-radioactivity concrete is given in per cent.
surrounded by equally special low-radioactivity concrete. Track | of this (Schlumberger) presentation shows two
An API unit is 1/200 of the difference between the two curves, the CGR and SGR. The SGR, or standard gamma
radioactivities (Belknap ef af., 1959). If a particular ray, is the total contribution of the three elements in
gamma ray tool is tested, the API unit for that tool is 1/200 API units. That is, it is the same as the simple gamma ray
of the difference between the low and high values. Thus, log, but re-constructed from the elemental values plotted
not only does the Houston pit serve as a standard for the on tracks 2 and 3. To arrive at this value (for the
API unit, it also serves to calibrate a tool. Schlumberger NGT-A) the following multipliers are
The simple gamma ray log is usually recorded in track used: Ippm U = 8.09 API units, 1 ppm Th = 3.93 API
1 along with the caliper. Scales are chosen locally, but units, 1% K = 16,32 API units. Thus, 3 ppm of uranium in
(A) GAMMA RAY LOG
(m)
other logs other logs
(SP, caliper etc.) (resistivity, sonic, density neutron ete.)
depths
GAMMA RAY
(AP 1)
1900.0
gamma-~ray |
r ga
70 API)
(B} SPECTRAL GAMMA RAY LOG
POTA
po SGR_ APD wie THOR (PPM)
(%)
a0 100. = ©.0 40.00 [0.0 6.1000
SGR (AP 1} a URAN (PPM) __
0.0 100.6 7° a.0 40.00 20.00 30.00
1650
|
{
4 ¥ 5 ‘ ‘
z 3 2
Rs i f | Pi BET I I
bd !
gamma-ray BO + total § thorium 4 | uranium ami potassium 1%
without —+—4 + gamma-ray mt I
yr
uranium | PS | <} ppm | Yi | |
TEER
| te | I | | 7 ital
x ralali
4
f -
1) | AgT A |
Figure 7.6 Typical gamma ray and spectral gamma ray log headings.
71