
Page 76 - The Geological Interpretation of Well Logs
P. 76
~- THE GEOLOGICAL [NTERPRETATION OF WELL LOGS -
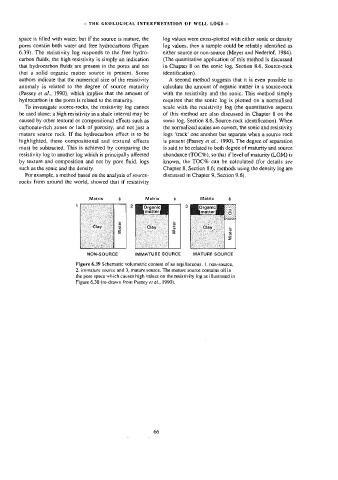
space is filled with water, but if the source is mature, the log values were cross-plotted with either sonic or density
pores contain both water and free hydrocarbons (Figure log values, then a sample could be reliably identified as
6.39). The resistivity log responds to the free hydro- either source or non-source (Meyer and Nederlof, 1984).
carbon fluids, the high resistivity is simply an indication (The quantitative application of this method is discussed
that hydrocarbon fluids are present in the pores and not in Chapter 8 on the sonic log, Section 8.6, Source-rock
that a solid organic matter source is present. Some identification).
authors indicate that the numerical size of the resistivity A second method suggests that it is even possible to
anomaly is related to the degree of source maturity calculate the amount of organic matter in a source-rock
(Passey et af., 1990), which implies that the amount of with the resistivity and the sonic. This method simply
hydrocarbon in the pores is related to the maturity. requires that the sonic log is plotted on a normalised
To investigate source-rocks, the resistivity log cannot scale with the resistivity log (the quantitative aspects
be used alone: a high resistivity in a shale interval may be of this method are also discussed in Chapter 8 on the
caused by other textural or compositional effects such as sonic log, Section 8.6, Source-rock identification). When
carbonate-rich zones or lack of porosity, and not just a the normalized scales are correct, the sonic and resistivity
mature source rock. If the hydrocarbon effect is to be logs ‘track’ one another but separate when a source rock
highlighted, these compositional and textural effects is present (Passey et al., 1990). The degree of separation
must be subtracted. This is achieved by comparing the is said to be related to both degree of maturity and source
resistivity log to another log which is principally affected abundance (TOC%), so that if leve] of maturity (LOM) is
by texture and composition and not by pore fluid, logs known, the TOC% can be calculated (for details see
such as the sonic and the density. Chapter 8, Section 8.6; methods using the density log are
For example, a method based on the analysis of source- discussed in Chapter 9, Section 9.6).
rocks from around the world, showed that if resistivity
Matrix 6 Matrix o Matrix >
Organic
3 Organic A.
5
matter
matter
Water Water Water
NON-SOURCE IMMATURE SOURCE MATURE SOURCE
Figure 6.39 Schematic volumewic content of an argillaceous, |. non-source,
2. immature source and 3, mature source. The mature source contains oil in
the pore space which causes high values on the resistivity log as illustrated in
Figure 6.38 (re-drawn from Passey e7 al.. 1990).
66