
Page 72 - The Geological Interpretation of Well Logs
P. 72
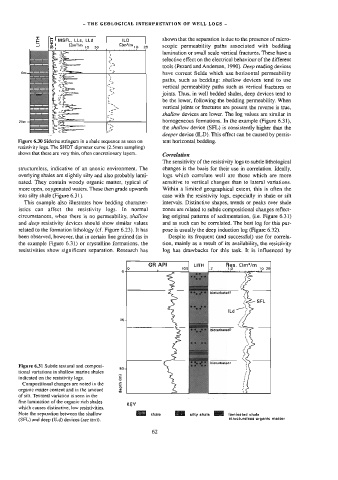
a!                               20    shown  that  the  separation  is  due  to  the  presence  of  micro-

                              -  THE  GEOLOGICAL  INTERPRETATION  OF  WELL  LOGS  -


              =  [5!  mset,  tis,  od
                                      |
                                            ILD
                         Qm2im  10
                                  20
                                           mim  49
              3
                                                          scopic  permeability  paths  associated  with  bedding

                                        Meer
                                                          lamination  or  small  scale  vertical  fractures.  These  have  a
                                         v                selective  effect  on  the  electrical  behaviour  of  the  different
                                        ny                tools  (Pezard  and  Anderson,  1990).  Deep  reading  devices
                                         Wi
         Om                                               have  current  fields  which  use  horizontal  permeability
                                        Nese]             paths,  such  as  bedding:  shallow  devices  tend  to  use
                                       7,   vv            vertical  permeability  paths  such  as  vertical  fractures  or
                                        Sat   ¥           joints.  Thus,  in  well  bedded  shales,  deep  devices  tend  to
                                       a                  be  the  lower,  following  the  bedding  permeability.  When
                                         fF
                                         4
                                         4  f             vertical  joints  os  fractures  are  present  the  reverse  is  true,
                                       a
                                       ry   MEAs          Shallow  devices  are  lower.  The  log  values  are  similar  in
        25m                                               homogeneous  formations.  In  the  example  (Figure  6.31},
                                       f   t
                                        Va   we           the  shallow  device  (SFL)  is  consistently  higher  than  the
                                                         >
                                                          deeper  device  (ILD).  This  effect  can  be  caused  by  persis-
       Figure  6.30  Siderite  stringers  in  a  shale  sequence  as  seen  on   tent  horizontal  bedding.
       resistivity  logs.  The  SHDT  dipmeter  curve  (2.5mm  sampling)
       shows  that  these  are  very  thin,  often  concretionary  layers.
                                                          Correlation
                                                          The  sensitivity  of  the  resistivity  logs  to  subtle  lithological
        structureless,  indicative  of  an  anoxic  environment.  The   changes  is  the  basis  for  their  use  in  correlation.  Ideally,
        overlying  shales  are  slightly  silty  and  also  probably  tami-   logs  which  correlate  well  are  those  which  are  more
        nated.  They  contain  woody  organic  matter,  typical  of   sensitive  to  vertical  changes  than  to  latera)  variations.
        more  open,  oxygenated  waters,  These  then  grade  upwards   Within  a  limited  geographical  extent,  this  is  often  the
        into  silty  shale  (Figure  6.31).               case  with  the  resistivity  logs,  especially  in  shale  or  silt
          This  example  also  illustrates  how  bedding  character-   intervals.  Distinctive  shapes,  trends  or  peaks  over  shale
        istics  can  affect  the  resistivity  logs.   In  normal   zones  are  related  to  subtle  compositional  changes  reflect-
        circumstances,  when  there  is  no  permeability,  shallow   ing  original  patterns  of  sedimentation,  (i.e.  Figure  6.31)
        and  deep  resistivity  devices  should  show  similar  values   and  as  such  can  be  correlated.  The  best  log  for  this  pur-
        related  to  the  formation  lithology  (cf.  Figure  6.23).  It  has   pose  is  usually  the  deep  induction  log  (Figure  6.32).
        been  observed,  however,  that  in  certain  fine  grained  (as  in   Despite  its  frequent  (and  successful)  use  for  correla-
        the  example  Figure  6.31)  or  crystalline  formations,  the   tion,  mainly  as  a  result  of  its  availability,  the  resistivity
        resistivities  show  significant  separation,  Research  has   log  has  drawbacks  for  this  task.  It  is  influenced  by

                                                     GR  API         LITH       Res.  OQm2/m
                                              °         ,        100       12   .   1,0   _   Ie  20
                                            ©


                                                                           dioturbated?   i
                                                                                       fez  SFL
                                                                                       '
                                                                                    ee Ny
                                                                                 ILd   :
                                           254
                                                                                     i
                                                                >          bioturbated?   NS
                                                                                       \
                                                                                       Lf


        Figure  6.31  Subtle  textural  and  composi-   50-                bioturbated?   S
        tional  variations  in  shallow  marine  shales   _
        indicated  on  the  resistivity  logs.   £
         Compositional  changes  are  noted  in  the   =                              Hi
        organic  matter  content  and  in  the  amount   2
        of  silt.  Textural  variation  is  seen  in  the
        fine  lamination  of  the  organic  rich  shales   KEY
        which  causes  distinctive,  low  resistivities.
        Note  the  separation  between  the  shallow   shale   eS   silty  shale   pal   laminated  shale
        (SFL)  and  deep  (ILd)  devices  (see  text).                           structureless  organic  matter