
Page 70 - The Geological Interpretation of Well Logs
P. 70
- THE GEOLOGICAL INTERPRETATION OF WELL LOGS -
unimodal porosity (Keith and Pittman, 1983). The effect resistivity logs through a shale with numerous siderite-
of each of these facies on the resistivity log is quite rich stringers and concretions (Figure 6.30). The lithology
distinct. Thus, for the same porosity value, the unimodal is known from cores and consists in general of bedded
porosity facies {skeletal} shows a higher resistivity than shales with very thin beds, bands and concretionary beds
the bimodal (ooid}. This is brought out by plotting of sideritic shale. Even the thinnest siderite rich interval is
density log porosities against resistivity from the shallow recorded on the resistivity curves. Of the example logs
laterolog corrected for R_, (Figure 6.26). The textural (Figure 6.30}, the SHDT curve, with a 2.5 mm sample
difference between the facies is most distinctly shown by spacing, shows the fine detail. This detai] is slightly
their behaviour to invasion—plotting corrected invasion- smoothed out by the MSFL log and greatly smoothed by
zone resistivities against R, (un-invaded formation) the deep induction log (both sampled at 15 cm), neverthe-
clearly separates the facies. The authors found that less the sensitivity to the small variations in the shales is
resistivity, especially from the invaded zone, was a better clear. The resistivity logs are in fact responding to two
discriminator of facies than porosity. things, both quite subtle: changes in texture and changes
The example of the Rodessa limestone simply shows in composition.
that the two porosity populations have different F values.
If porosity is facies related, so is F, and the resistivity log
becomes an excellent facies discriminator.
> SFL resistivity
Grass lithology a Induction resistivity
Resistivity logs cannot be used for a first recognition of x ohm m2/m
c 0.2 1.0 40
the common lithologies. There are no characteristic
7
Lt
Liiiul
pil
resistivity Jimits for shale, or limestone or sandstone. The
N,
values depend on many variables such as compaction,
composition, fluid content and so on. However, in any TS SD
=
restricted zone, gross characteristics tend to be constant a
and the resistivity log may be used as a discriminator. For o 47°
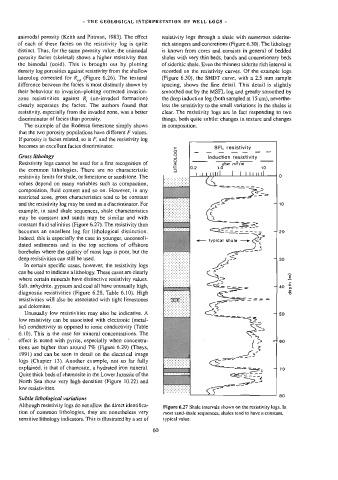
example, in sand shale sequences, shale characteristics t sn
may be constant and sands may be similar and with % —~ SS =>
constant fluid salinities (Figure 6.27). The resistivity then
ae ee
becomes an excellent log for lithological distinction. Ssitsss---5 6-20
>
Indeed, this is especially the case in younger, unconsoli-
~t— typical shale —+» ae
dated sediments and in the top sections of offshore
——:
boreholes where the quality of most logs is poor, but the
oS
deep resistivities can still be used. => | 30
a
In certain specific cases, however, the resistivity logs ‘s
$
can be used to indicate a lithology. These cases are clearly <a
where certain minerals have distinctive resistivity values. (m
oe
Salt, anhydrite, gypsum and coal all have unusually high, Se cL 4 40 depth
diagnostic resistivities (Figure 6.28, Table 6.10). High
resistivities will also be associated with tight limestones pr T= ~
and dolomites. —
<
Unusually low resistivities may also be indicative. A s” _ 50
ee
low resistivity can be associated with electronic (metal- 2S
lic) conductivity as opposed to ionic conductivity (Table
>>
6.10). This is the case for mineral concentrations. The
4
effect is noted with pyrite, especially when concentra- ( > 47 60
tions are higher than around 7% (Figure 6.29) (Theys, 7
1991) and can be seen in detail on the electrical image
logs (Chapter 13). Another example, not so far fully wa _ ao
explained, is that of chamosite, a hydrated iron mineral. — = 7 70
Quite thick beds of chamosite in the Lower Jurassic of the ar
North Sea show very high densities (Figure 10,22) and —e oe ”
low resistivities. co
80
Subtle lithological variations
Although resistivity logs do not allow the direct identifica-
Figure 6.27 Shale intervals shown on the resistivity logs. In
tion of common lithologies, they are nonetheless very most sand-shale sequences, shales tend to have a constant,
sensitive lithology indicators. This is illustrated by a set of typical value.
60