
Page 69 - The Geological Interpretation of Well Logs
P. 69
- RESISTIVITY AND CONDUCTIVITY LOGS -
RESISTIVITY SFL om m? sm
2 1,0 190 100, 20 |
ras
oy
isl
po
Dl
st
el
—
R SFL z 15 | J
B ~ 10 | 4 1
ly
"ore
og
a
«
ave
Ioo@
.
3
2
oa
emo
«
oO
a
ba
oa
5 |
oo
*
«og
a of o
3
r25m
.
“ne
0 4 J 7
—
St
es
a“ poroshly
10 100 1000
resistivity Ryo/Rmi
- bimodal porosity system
=
bs oO unimodal porosity system
é S 60m
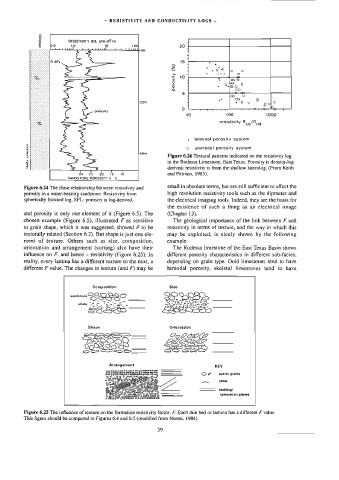
o Figure 6.26 Textural patterns indicated on the resistivity log
yn
2 in the Rodessa Limestone, East Texas. Porosity is density-log
2 derived: resistivity is from the shallow laterolog. (From Keith
|
{
T
q
q
205
250
10
30
SANDSTONE POROSITY ©
%
and Pittman, 1983).
smal] in absolute terms, but are still sufficient to affect the
Figure 6.24 The close relationship between resistivity and
porosity in a water-bearing sandstone. Resistivity from high resolution resistivity tools such as the dipmeter and
spherically focused log, SFL: porosity is log-derived. the electrical imaging tools. Indeed, they are the basis for
the existence of such a thing as an electrical image
and porosity is only one element of it (Figure 6.5). The (Chapter 13).
chosen example (Figure 6.5), illustrated F as sensitive The geological importance of the link between F and
to grain shape, which it was suggested, showed F to be resistivity in terms of texture, and the way in which this
texturally related (Section 6.2). But shape is just one ele- may be exploited, is nicely shown by the following
ment of texture. Others such as size, composition, example.
orientation and arrangement (sorting) also have their The Rodessa limestone of the East Texas Basin shows
influence on F, and hence — resistivity (Figure 6.25). In different porosity characteristics in different sub-facies,
reality, every lamina has a different texture to the next, a depending on grain type. Ooid limestones tend to have
different F value. The changes in texture (and F) may be bimodal porosity, skeletal limestones tend to have
Compositlon
rantsons SSRI
shala 17 =
S8EE5
—_
Shape Orentation
a 8
EE
RROD
O
OS
£0 S299 SES
Arrangement KEY
POSSE OBIS SOOO CO DOOOSOO SS Os Quartz grains
shale
—
bedding/
lamination planes
Figure 6.25 The influence of texture on the formation resistivity factor, F. Each thin bed or lamina has a different F value.
This figure should be compared to Figures 6.4 and 6.5 (modified from Nurmi, 1984).
59