
Page 182 - The Green Building Bottom Line The Real Cost of Sustainable Building
P. 182
160 CHAPTER 5
Abercorn Common are the costs one might typically associate with pioneering efforts
that are compensated for by first-mover advantage.
So what of those early benefits? Like some of the more intangible aspects of cost-
ing the LEED premium, while we realize that we have benefited by our pioneering
efforts at Abercorn Common, it is hard to put a hard dollar number on them. Did the
time it took to lease the center at some point become easier as a result of the green
brand we were creating? We believe it did, though we lack a benchmark to compare it
to. Did we see an increase in the rental rates we were able to negotiate over the time
of the development? In fact, we did see an increase, with initial rental rates negotiated
in the $15- to $17-per-square foot range, and later rental rates realized in the $35-per-
square-foot range. But how much of that increase is simply attributable to the market
getting comfortable that a development on paper was becoming a reality, how much
to the fact that vacant space was becoming more limited, and how much to the green
brand of Abercorn Common? Anecdotally, we feel that the green brand was a small
contributing factor to the up-tick in rents—and even a small portion of a 100 percent
increase in gross income is significant. However, since we don’t feel comfortable
assigning a percentage benefit, we will leave it out of our analysis. We did see an over-
all increase in the valuation of Abercorn as part of our refinancing of an entire green
portfolio. That increase is factored into our analysis in Chapter 4.
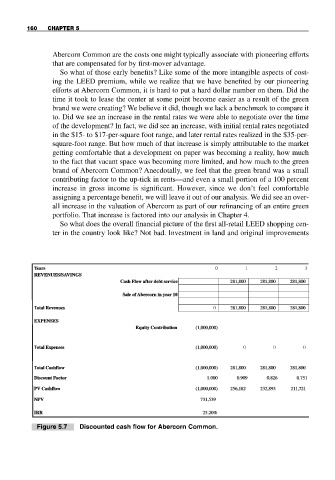
So what does the overall financial picture of the first all-retail LEED shopping cen-
ter in the country look like? Not bad. Investment in land and original improvements
Y Years 0 1 2 3
ears
REVENUES/SAVINGS
REVENUES/SA VINGS
after
Cash
Cash Flow after debt service 281,800 281,800 281,800
281,800
Flow
281,800
281,800
debt
service
Sale of Abercorn in year 1010
Sale of Aber c o r ni ny e a r
281,800
281,800
Total Revenuesotal Revenues 0 281,800 281,800 281,800
281,800
EXPENSES
EXPENSES
(1,000,000)
Equity Contribution
Equity Contribution (1,000,000)
(1,000,000)
Total Expensesotal Expenses (1,000,000) 0 0 0
(1,000,000)
281,800
281,800
281,800
Total Cashflowotal Cashflow (1,000,000) 281,800 281,800 281,800
Discount Factor 1.000 0.909 0.826 0.751
1.000
0.909
Discount Factor
0.826
0.751
232,893
Cashflow
256,182
PV
PV Cashflow (1,000,000) 256,182 232,893 211,721
(1,000,000)
21
1,721
NPV
NPV 731,539
731,539
25.20%
IRR
IRR 25.20%
Figure 5.7 Discounted cash flow for Abercorn Common.