
Page 52 - The Petroleum System From Source to Trap
P. 52
44 Smith
present along a migration path would have produced a
detectable show in the presence of the large background
created by the coal layers in the COST-2 welL
t
For the pre-red sequence in the COST-2 well, Shell N
estimated that there were 343 net-ft of sandstone with an •
average porosity of 9% between the red unconformity
and 12,800 ft, and 400 net-ft of sandstone with an average
porosity of 11% between 12,800 and 14,200 ft. The
interval above 12,800 ft contains only one coal bed, which
could charge 40 net-ft of sandstone, 20 net ft-above the
coal and 20 net-ft below the coaL Thus, in the COST-2
well, we estimated that the pre-red sequence contained
440 net-ft of sandstone that was available for the strati
graphic trapping of gas. If half of the sandstone traps gas,
as suggested by the gas show evidence, there would be
220 net-ft of gas. For the gas-expelling region, the model
thus assumes that 220 net-ft of sand contains trapped
gas. An average porosity of 9% and an average gas satu D SOURCE AREA FOR GAS
ration of 50% are also assumed for these accumulations. D PROSPECT CHUGACH
Using an average depth of 15,000 ft and an average
FETCH AREA BOUNDARIES
pressure of 7500 psi for the accumulations trapped in the
� � � FAULT CONTROLLED
pre-red gas-expelling region, these parameters lead to a
prediction of 60 x 109 SCF/mi2 of trapped gas. This DIP CONTROLLED
migration loss estimate may be conservative for the DIRECTION OF
HYDROCARBON FLOW 10KM
following reasons: (1) the thickness of the pre-red coal
6.2 MILES
bearing section increases in the gas-expelling region,
which probably leads to an increase in net-feet of
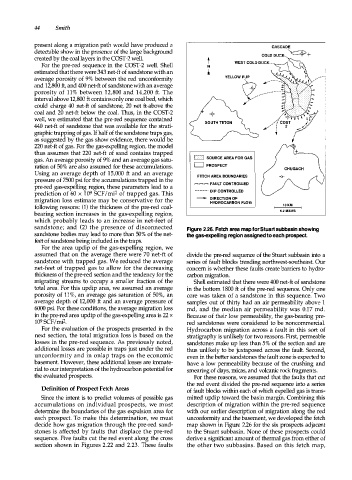
sandstone; and (2) the presence of disconnected Figure 2.26. Fetch area map for Stuart subbasin showing
sandstone bodies may lead to more than 50% of the net the gas-expelling region assigned to each prospect.
feet of sandstone being included in the traps.
For the area updip of the gas-expelling region, we
assumed that on the average there were 70 net-ft of divide the pre-red sequence of the Stuart subbasin into a
sandstone with trapped gas. We reduced the average series of fault blocks trending northwest-southeast. Our
net-feet of trapped gas to allow for the decreasing concern is whether these faults create barriers to hydro
thickness of the pre-red section and the tendency for the carbon migration.
migrating streams to occupy a smaller fraction of the Shell estimated that there were 400 net-ft of sandstone
total area. For this updip area, we assumed an average in the bottom 1800 ft of the pre-red sequence. Only one
porosity of 1 1 % , an average gas saturation of 50%, an core was taken of a sandstone in this sequence. Two
average depth of 12,000 ft and an average pressure of samples out of thirty had an air permeability above 1
6000 psi. For these conditions, the average migration loss md, and the median air permeability was 0.17 md.
in the pre-red area updip of the gas-expelling area is 22 x Because of their low permeability, the gas-bearing pre
109 SCF/mi2. red sandstones were considered to be noncommerciaL
For the evaluation of the prospects presented in the Hydrocarbon migration across a fault in this sort of
next section, the total migration loss is based on the stratigraphy is unlikely for two reasons. First, permeable
losses in the pre-red sequence. As previously noted, sandstones make up less than 5% of the section and are
additional losses are possible in traps just under the red thus unlikely to be juxtaposed across the fault. Second,
unconformity and in onlap traps on the economic even in the better sandstones the fault zone is expected to
basement. However, these additional losses are immate have a low permeability because of the crushing and
rial to our interpretation of the hydrocarbon potential for smearing of clays, micas, and volcanic rock fragments.
the evaluated prospects. For these reasons, we assumed that the faults that cut
the red event divided the pre-red sequence into a series
Definition of Prospect Fetch Areas of fault blocks within each of which expelled gas is trans
Since the intent is to predict volumes of possible gas mitted updip toward the basin margin. Combining this
accumulations on individual prospects, we must description of migration within the pre-red sequence
determine the boundaries of the gas expulsion area for with our earlier description of migration along the red
each prospect. To make this determination, we must unconformity and the basement, we developed the fetch
decide how gas migration through the pre-red sand map shown in Figure 2.26 for the six prospects adjacent
stones is affected by faults that displace the pre-red to the Stuart subbasin. None of these prospects could
sequence. Five faults cut the red event along the cross derive a significant amount of thermal gas from either of
section shown in Figures 2.22 and 2.23. These faults the other two subbasins. Based on this fetch map,