
Page 50 - The Petroleum System From Source to Trap
P. 50
42 Smith
N s
COST NO. 2
PROJ. - 1 /2 MI.
.
.,;
����7 .::: 1 1...._ .. , ...
...,_ � ;" sc.N
-� -
-��;����;:�·=
Ill
3 �
0
z
c
Ill
4
1 MILE
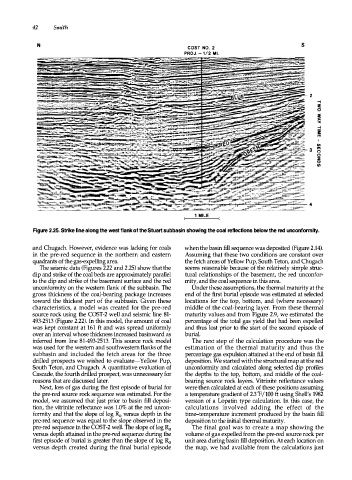
Figure 2.25. Strike line along the west flank of the Stuart subbasin showing the coal reflections below the red unconformity.
and Chugach. However, evidence was lacking for coals when the basin fill sequence was deposited (Figure 2.14).
in the pre-red sequence in the northern and eastern Assuming that these two conditions are constant over
quadrants of the gas-expelling area. the fetch areas of Yellow Pup, South Teton, and Chugach
The seismic data (Figures 2.22 and 2.25) show that the seems reasonable because of the relatively simple struc
dip and strike of the coal beds are approximately parallel tural relationships of the basement, the red unconfor
to the dip and strike of the basement surface and the red mity, and the coal sequence in this area.
unconformity on the western flank of the subbasin. The Under these assumptions, the thermal maturity at the
gross thickness of the coal-bearing package increases end of the first burial episode was estimated at selected
toward the thickest part of the subbasin. Given these locations for the top, bottom, and (where necessary)
characteristics, a model was created for the pre-red middle of the coal-bearing layer. From these thermal
source rock using the COST-2 well and seismic line 81- maturity values and from Figure 2.9, we estimated the
493-2513 (Figure 2.22). In this model, the amount of coal percentage of the total gas yield that had been expelled
was kept constant at 161 ft and was spread uniformly and thus lost prior to the start of the second episode of
over an interval whose thickness increased basinward as burial.
inferred from line 81-493-2513. This source rock model The next step of the calculation procedure was the
was used for the western and southwestern flanks of the estimation of the thermal maturity and thus the
subbasin and included the fetch areas for the three percentage gas expulsion attained at the end of basin fill
drilled prospects we wished to evaluate-Yellow Pup, deposition. We started with the structural map at the red
South Teton, and Chugach. A quantitative evaluation of unconformity and calculated along selected dip proffies
Cascade, the fourth drilled prospect, was unnecessary for the depths to the top, bottom, and middle of the coal
reasons that are discussed later. bearing source rock layers. Vitrinite reflectance values
Next, loss of gas during the first episode of burial for were then calculated at each of these positions assuming
the pre-red source rock sequence was estimated. For the a temperature gradient of 2.3 "F I 100 ft using Shell's 1982
model, we assumed that just prior to basin fill deposi version of a Lopatin type calculation. In this case, the
tion, the vitrinite reflectance was 1 . 0% at the red uncon calculations involved adding the effect of the
formity and that the slope of log Ra versus depth in the time-temperature increment produced by the basin fill
pre-red sequence was equal to the slope observed in the deposition to the initial thermal maturity.
pre-red sequence in the COST-2 well. The slope of log Ra The final goal was to create a map showing the
versus depth attained in the pre-red sequence during the volume of gas expelled from the pre-red source rock per
first episode of burial is greater than the slope of log Ra unit area during basin fill deposition. At each location on
versus depth created during the final burial episode the map, we had available from the calculations just