
Page 46 - The Petroleum System From Source to Trap
P. 46
38 Smith
CASCADE hydrocarbons moving updip from the area containing
COLD DUCK � + mature source rocks in the basin fill sequence. Such
�Y-0398 #1
t WEST COLD DUCK� \._j hydrocarbons would be expected to migrate updip in the
N first sandstone above economic basement. According to
• Desautels (1988), these wells lacked oil shows. This
�-0407111 agreement with Shell's interpretation that there was a
YELLOW PUP absence of oil shows along expected migration paths is in
low probability of finding conunercial oil reserves in the
prospects adjacent to the Stuart subbasin.
Part II: The Petroleum System of the Stuart
Subbasin
After Shell concluded that the probability of finding
commercial oil reserves anywhere in the Norton basin
was very small, little effort was devoted to a rigorous
evaluation of the migration and trapping characteristics
for prospects in or adjacent to the different subbasins.
CHUGACH
D SOURCE AREA FOR GAS Therefore, Shell's presale evaluation is an incomplete
D PROSPECT example of the use of the petroleum system logic as a
tool in frontier exploration. However, the geology in and
l O K M
6.2 MILES around the Stuart subbasin and the exploration effort
expended on it (including the five wells drilled by Exxon
and Elf in partnership or alone) combine to make the
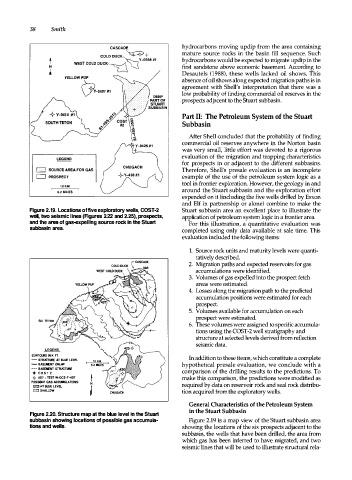
Figure 2.19. Locations of five exploratory wells, COST -2 Stuart subbasin area an excellent place to illustrate the
well, two seismic lines (Figures 2.22 and 2.25), prospects, application of petroleum system logic in a frontier area.
and the area of gas-expelling source rock in the Stuart For this illustration, a quantitative evaluation was
subbasin area. completed using only data available at sale time. This
evaluation included the following items:
1. Source rock units and maturity levels were quanti
tatively described.
2. Migration paths and expected reservoirs for gas
accumulations were identified.
3. Volumes of gas expelled into the prospect fetch
areas were estimated.
4. Losses along the migration path to the predicted
accumulation positions were estimated for each
prospect.
5. Volumes available for accumulation on each
prospect were estimated.
6. These volumes were assigned to specific accumula
tions using the COST-2 well stratigraphy and
structure at selected levels derived from reflection
seismic data.
CONTOIJ'IS IN M FT
- STRUCTURE AT BLUE LEVEL In addition to these items, which constitute a complete
- BASEMENT ONLAP hypothetical presale evaluation, we conclude with a
--- BASEIIENT STRUCTURE
... COST 2 comparison of the drilling results to the predictions. To
-<>- 407 - TEST IN OCS-Y -407 t make this comparison, the predictions were modified as
POSSIBLE GAS ACCUMULATIONS: N
!iiiD AT BLUE LEVEL required by data on reservoir rock and seal rock distribu
0 S HALLOW � CH.IGACH tion acquired from the exploratory wells.
General Characteristics of the Petroleum System
Figure 2.20. Structure map at the blue level in the Stuart in the Stuart Subbasin
subbasin showing locations of possible gas accumula Figure 2.19 is a map view of the Stuart subbasin area
tions and wells. showing the locations of the six prospects adjacent to the
subbasin, the wells that have been drilled, the area from
which gas has been inferred to have migrated, and two
seismic lines that will be used to illustrate structural rela-